Croatian vs Immigrants from Mexico Currently Married
COMPARE
Croatian
Immigrants from Mexico
Currently Married
Currently Married Comparison
Croatians
Immigrants from Mexico
48.9%
CURRENTLY MARRIED
99.5/ 100
METRIC RATING
29th/ 347
METRIC RANK
44.5%
CURRENTLY MARRIED
0.7/ 100
METRIC RATING
239th/ 347
METRIC RANK
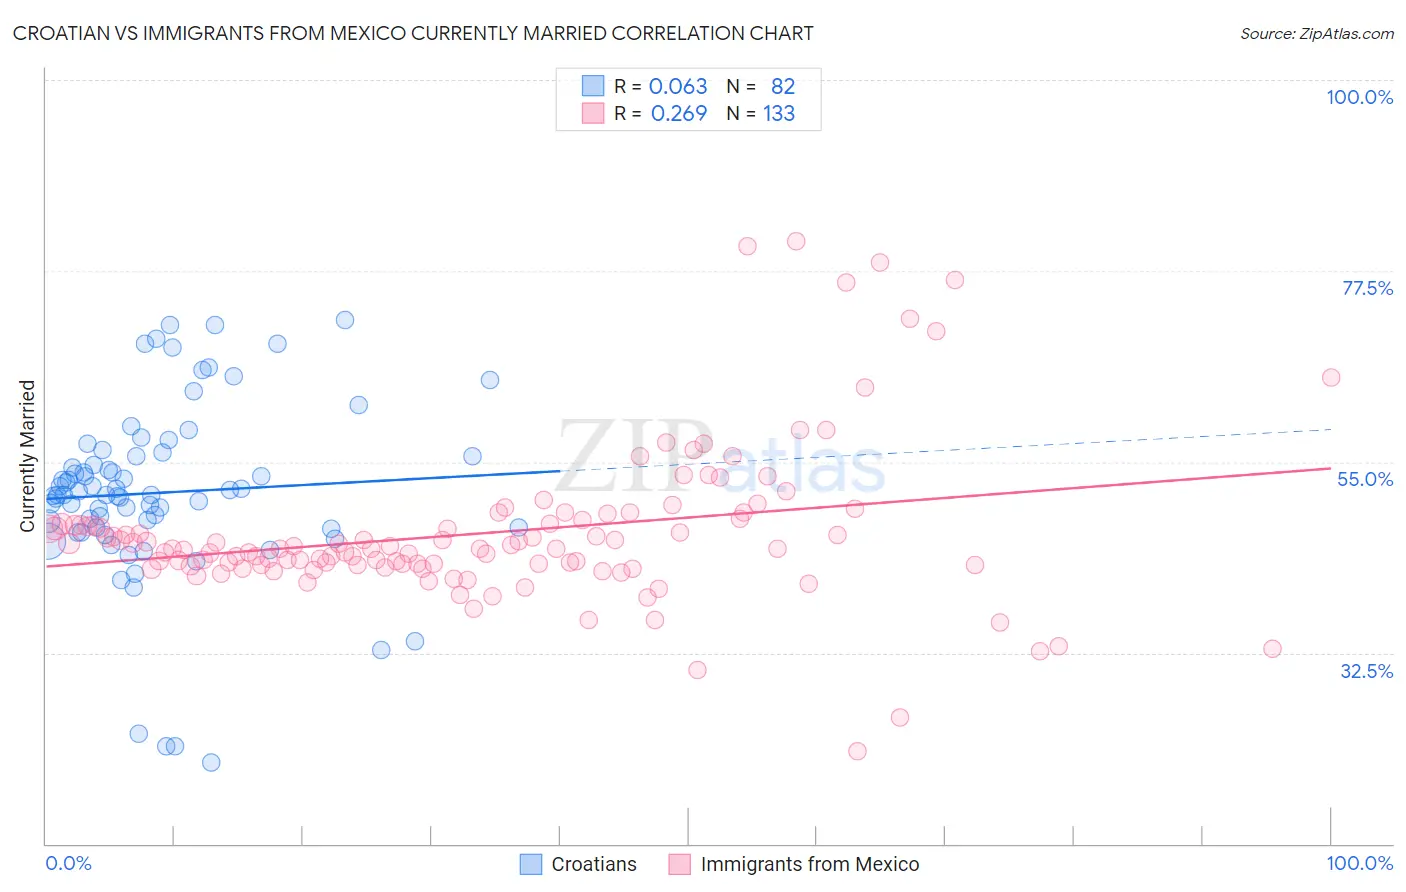
Croatian vs Immigrants from Mexico Currently Married Correlation Chart
The statistical analysis conducted on geographies consisting of 375,687,747 people shows a slight positive correlation between the proportion of Croatians and percentage of population currently married in the United States with a correlation coefficient (R) of 0.063 and weighted average of 48.9%. Similarly, the statistical analysis conducted on geographies consisting of 513,698,196 people shows a weak positive correlation between the proportion of Immigrants from Mexico and percentage of population currently married in the United States with a correlation coefficient (R) of 0.269 and weighted average of 44.5%, a difference of 9.8%.
Currently Married Correlation Summary
| Measurement | Croatian | Immigrants from Mexico |
| Minimum | 19.6% | 20.9% |
| Maximum | 71.7% | 81.0% |
| Range | 52.1% | 60.1% |
| Mean | 51.4% | 46.6% |
| Median | 51.1% | 44.8% |
| Interquartile 25% (IQ1) | 47.2% | 42.8% |
| Interquartile 75% (IQ3) | 55.7% | 47.9% |
| Interquartile Range (IQR) | 8.5% | 5.1% |
| Standard Deviation (Sample) | 10.5% | 9.3% |
| Standard Deviation (Population) | 10.4% | 9.2% |
Similar Demographics by Currently Married
Demographics Similar to Croatians by Currently Married
In terms of currently married, the demographic groups most similar to Croatians are Eastern European (48.9%, a difference of 0.010%), Polish (48.9%, a difference of 0.010%), Immigrants from Hong Kong (48.9%, a difference of 0.020%), Welsh (48.9%, a difference of 0.050%), and Irish (48.9%, a difference of 0.060%).
| Demographics | Rating | Rank | Currently Married |
| Bulgarians | 99.7 /100 | #22 | Exceptional 49.1% |
| Immigrants | Pakistan | 99.7 /100 | #23 | Exceptional 49.1% |
| Lithuanians | 99.6 /100 | #24 | Exceptional 49.0% |
| Maltese | 99.6 /100 | #25 | Exceptional 49.0% |
| Immigrants | Korea | 99.6 /100 | #26 | Exceptional 49.0% |
| Burmese | 99.6 /100 | #27 | Exceptional 48.9% |
| Welsh | 99.5 /100 | #28 | Exceptional 48.9% |
| Croatians | 99.5 /100 | #29 | Exceptional 48.9% |
| Eastern Europeans | 99.5 /100 | #30 | Exceptional 48.9% |
| Poles | 99.5 /100 | #31 | Exceptional 48.9% |
| Immigrants | Hong Kong | 99.5 /100 | #32 | Exceptional 48.9% |
| Irish | 99.5 /100 | #33 | Exceptional 48.9% |
| Immigrants | Lithuania | 99.4 /100 | #34 | Exceptional 48.8% |
| Immigrants | Northern Europe | 99.4 /100 | #35 | Exceptional 48.8% |
| Italians | 99.4 /100 | #36 | Exceptional 48.8% |
Demographics Similar to Immigrants from Mexico by Currently Married
In terms of currently married, the demographic groups most similar to Immigrants from Mexico are Mexican American Indian (44.5%, a difference of 0.0%), Ethiopian (44.5%, a difference of 0.060%), Immigrants from Cambodia (44.5%, a difference of 0.090%), Immigrants from Ethiopia (44.5%, a difference of 0.10%), and Moroccan (44.6%, a difference of 0.14%).
| Demographics | Rating | Rank | Currently Married |
| Nepalese | 1.2 /100 | #232 | Tragic 44.7% |
| Immigrants | Saudi Arabia | 1.1 /100 | #233 | Tragic 44.7% |
| Iroquois | 1.1 /100 | #234 | Tragic 44.7% |
| Alaskan Athabascans | 0.9 /100 | #235 | Tragic 44.6% |
| Cubans | 0.9 /100 | #236 | Tragic 44.6% |
| Seminole | 0.9 /100 | #237 | Tragic 44.6% |
| Moroccans | 0.9 /100 | #238 | Tragic 44.6% |
| Immigrants | Mexico | 0.7 /100 | #239 | Tragic 44.5% |
| Mexican American Indians | 0.7 /100 | #240 | Tragic 44.5% |
| Ethiopians | 0.7 /100 | #241 | Tragic 44.5% |
| Immigrants | Cambodia | 0.7 /100 | #242 | Tragic 44.5% |
| Immigrants | Ethiopia | 0.7 /100 | #243 | Tragic 44.5% |
| Japanese | 0.6 /100 | #244 | Tragic 44.5% |
| Immigrants | Armenia | 0.4 /100 | #245 | Tragic 44.3% |
| Immigrants | Burma/Myanmar | 0.4 /100 | #246 | Tragic 44.3% |