Creek vs Serbian Family Households with Children
COMPARE
Creek
Serbian
Family Households with Children
Family Households with Children Comparison
Creek
Serbians
27.4%
FAMILY HOUSEHOLDS WITH CHILDREN
39.8/ 100
METRIC RATING
187th/ 347
METRIC RANK
26.4%
FAMILY HOUSEHOLDS WITH CHILDREN
0.1/ 100
METRIC RATING
302nd/ 347
METRIC RANK
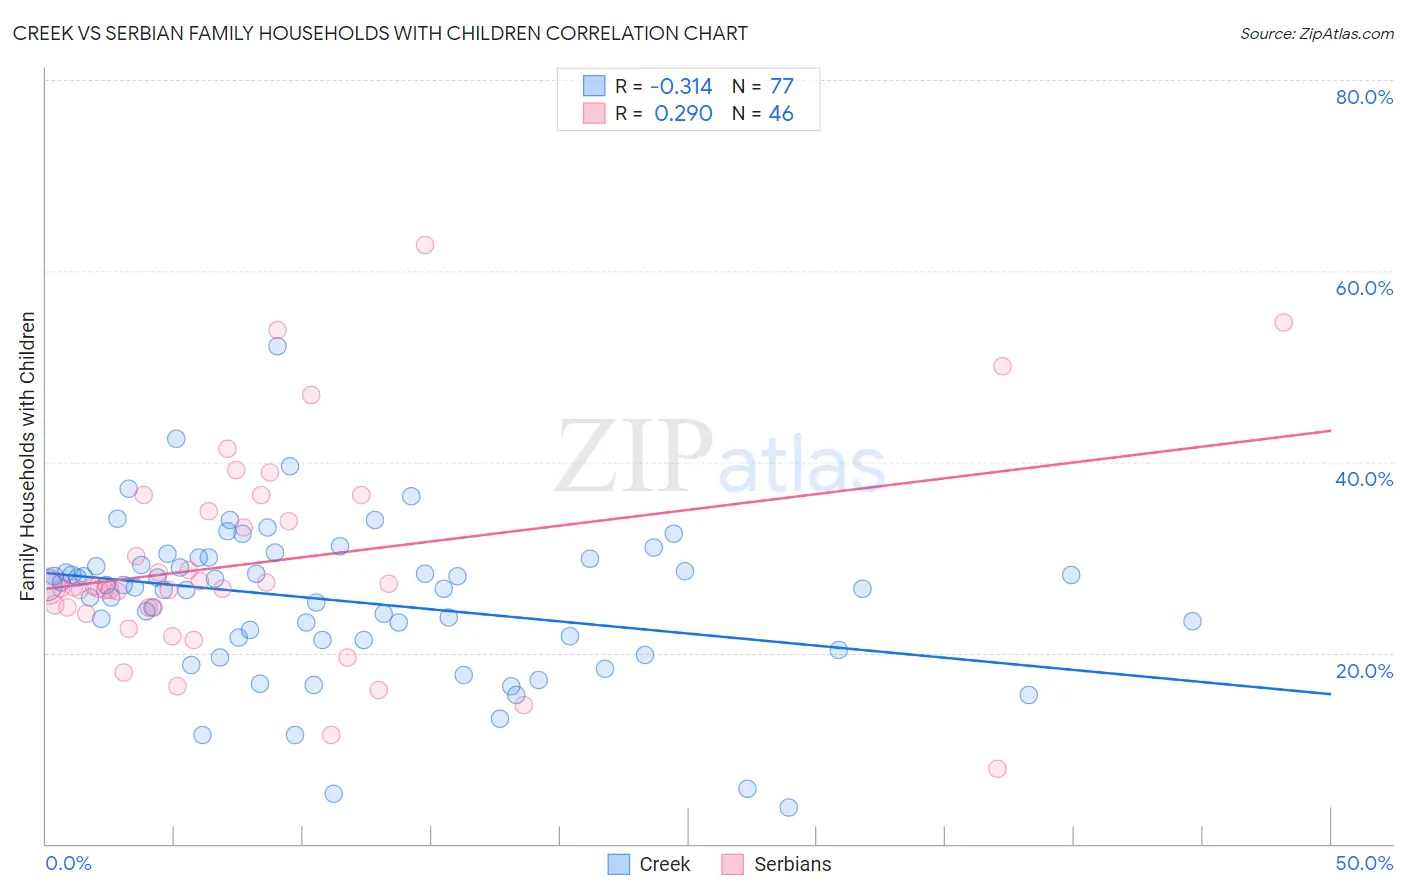
Creek vs Serbian Family Households with Children Correlation Chart
The statistical analysis conducted on geographies consisting of 178,422,790 people shows a mild negative correlation between the proportion of Creek and percentage of family households with children in the United States with a correlation coefficient (R) of -0.314 and weighted average of 27.4%. Similarly, the statistical analysis conducted on geographies consisting of 267,409,875 people shows a weak positive correlation between the proportion of Serbians and percentage of family households with children in the United States with a correlation coefficient (R) of 0.290 and weighted average of 26.4%, a difference of 3.9%.
Family Households with Children Correlation Summary
| Measurement | Creek | Serbian |
| Minimum | 3.8% | 7.8% |
| Maximum | 52.1% | 62.7% |
| Range | 48.3% | 54.8% |
| Mean | 25.4% | 29.5% |
| Median | 26.8% | 26.8% |
| Interquartile 25% (IQ1) | 21.3% | 24.7% |
| Interquartile 75% (IQ3) | 29.6% | 34.8% |
| Interquartile Range (IQR) | 8.2% | 10.1% |
| Standard Deviation (Sample) | 8.0% | 11.1% |
| Standard Deviation (Population) | 7.9% | 11.0% |
Similar Demographics by Family Households with Children
Demographics Similar to Creek by Family Households with Children
In terms of family households with children, the demographic groups most similar to Creek are Immigrants from Brazil (27.4%, a difference of 0.020%), Dutch (27.4%, a difference of 0.020%), Immigrants from Israel (27.4%, a difference of 0.040%), Delaware (27.4%, a difference of 0.050%), and Immigrants from Uruguay (27.4%, a difference of 0.050%).
| Demographics | Rating | Rank | Family Households with Children |
| Immigrants | Turkey | 46.9 /100 | #180 | Average 27.4% |
| Aleuts | 46.7 /100 | #181 | Average 27.4% |
| Puget Sound Salish | 46.2 /100 | #182 | Average 27.4% |
| South Africans | 44.9 /100 | #183 | Average 27.4% |
| Native Hawaiians | 44.6 /100 | #184 | Average 27.4% |
| Delaware | 42.0 /100 | #185 | Average 27.4% |
| Immigrants | Brazil | 40.6 /100 | #186 | Average 27.4% |
| Creek | 39.8 /100 | #187 | Fair 27.4% |
| Dutch | 38.8 /100 | #188 | Fair 27.4% |
| Immigrants | Israel | 37.9 /100 | #189 | Fair 27.4% |
| Immigrants | Uruguay | 37.7 /100 | #190 | Fair 27.4% |
| Sudanese | 37.6 /100 | #191 | Fair 27.4% |
| Pennsylvania Germans | 37.5 /100 | #192 | Fair 27.4% |
| Swedes | 36.9 /100 | #193 | Fair 27.4% |
| Immigrants | Iran | 36.1 /100 | #194 | Fair 27.4% |
Demographics Similar to Serbians by Family Households with Children
In terms of family households with children, the demographic groups most similar to Serbians are Immigrants from Trinidad and Tobago (26.4%, a difference of 0.010%), Paiute (26.4%, a difference of 0.030%), Immigrants from Guyana (26.3%, a difference of 0.030%), Immigrants from Bahamas (26.3%, a difference of 0.080%), and Guyanese (26.3%, a difference of 0.11%).
| Demographics | Rating | Rank | Family Households with Children |
| Macedonians | 0.1 /100 | #295 | Tragic 26.4% |
| Croatians | 0.1 /100 | #296 | Tragic 26.4% |
| Armenians | 0.1 /100 | #297 | Tragic 26.4% |
| Immigrants | Western Europe | 0.1 /100 | #298 | Tragic 26.4% |
| Trinidadians and Tobagonians | 0.1 /100 | #299 | Tragic 26.4% |
| Paiute | 0.1 /100 | #300 | Tragic 26.4% |
| Immigrants | Trinidad and Tobago | 0.1 /100 | #301 | Tragic 26.4% |
| Serbians | 0.1 /100 | #302 | Tragic 26.4% |
| Immigrants | Guyana | 0.1 /100 | #303 | Tragic 26.3% |
| Immigrants | Bahamas | 0.1 /100 | #304 | Tragic 26.3% |
| Guyanese | 0.1 /100 | #305 | Tragic 26.3% |
| Bermudans | 0.1 /100 | #306 | Tragic 26.3% |
| West Indians | 0.0 /100 | #307 | Tragic 26.3% |
| Lumbee | 0.0 /100 | #308 | Tragic 26.3% |
| Immigrants | Somalia | 0.0 /100 | #309 | Tragic 26.3% |