Creek vs Colombian Single Mother Households
COMPARE
Creek
Colombian
Single Mother Households
Single Mother Households Comparison
Creek
Colombians
7.0%
SINGLE MOTHER HOUSEHOLDS
1.6/ 100
METRIC RATING
230th/ 347
METRIC RANK
6.6%
SINGLE MOTHER HOUSEHOLDS
18.3/ 100
METRIC RATING
193rd/ 347
METRIC RANK
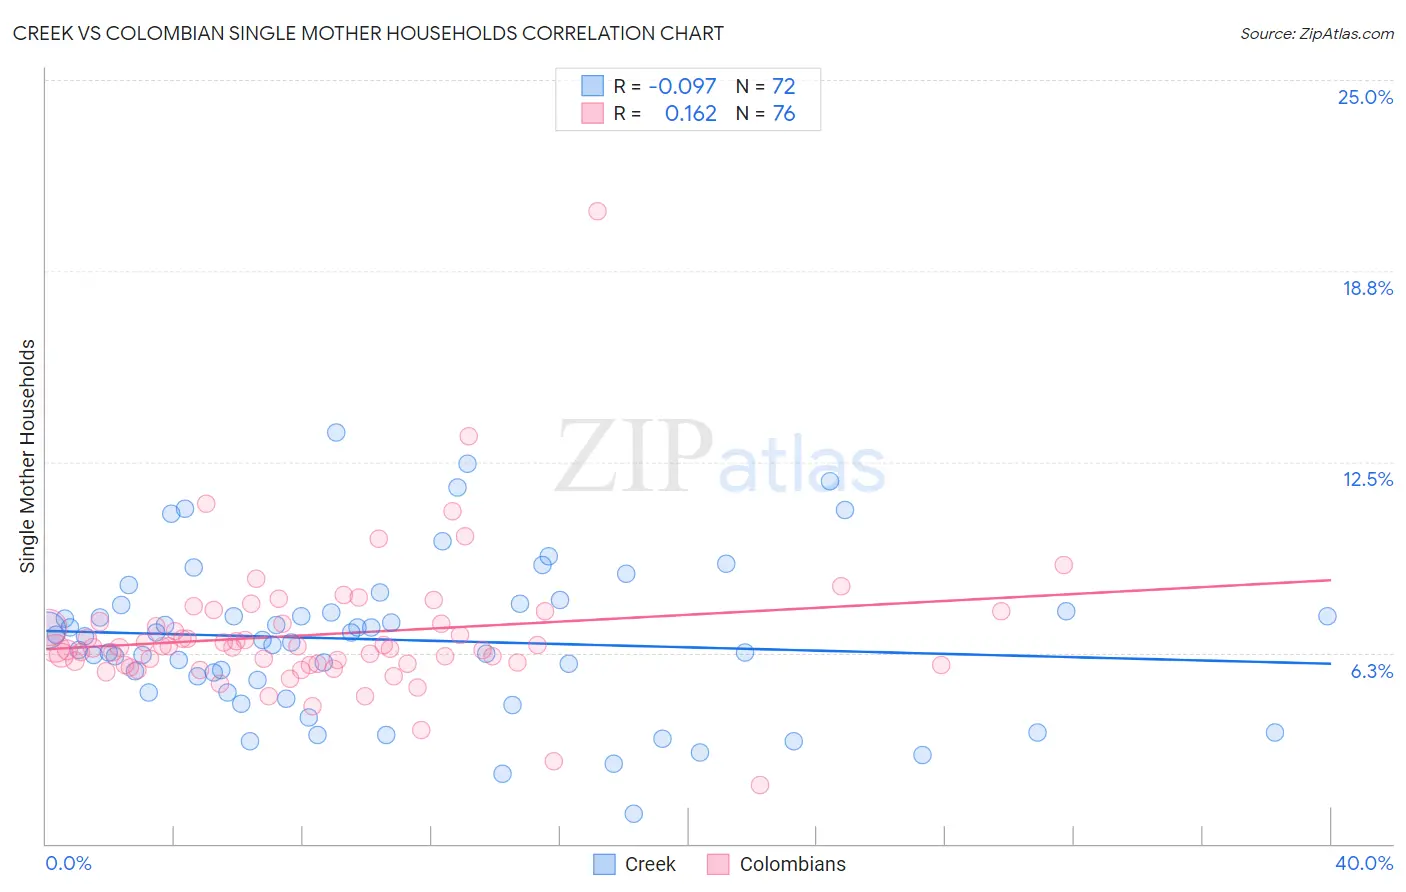
Creek vs Colombian Single Mother Households Correlation Chart
The statistical analysis conducted on geographies consisting of 178,256,539 people shows a slight negative correlation between the proportion of Creek and percentage of single mother households in the United States with a correlation coefficient (R) of -0.097 and weighted average of 7.0%. Similarly, the statistical analysis conducted on geographies consisting of 418,427,285 people shows a poor positive correlation between the proportion of Colombians and percentage of single mother households in the United States with a correlation coefficient (R) of 0.162 and weighted average of 6.6%, a difference of 6.9%.
Single Mother Households Correlation Summary
| Measurement | Creek | Colombian |
| Minimum | 0.97% | 1.9% |
| Maximum | 13.4% | 20.7% |
| Range | 12.5% | 18.8% |
| Mean | 6.7% | 6.9% |
| Median | 6.7% | 6.4% |
| Interquartile 25% (IQ1) | 5.1% | 5.9% |
| Interquartile 75% (IQ3) | 7.7% | 7.2% |
| Interquartile Range (IQR) | 2.6% | 1.4% |
| Standard Deviation (Sample) | 2.5% | 2.3% |
| Standard Deviation (Population) | 2.5% | 2.3% |
Similar Demographics by Single Mother Households
Demographics Similar to Creek by Single Mother Households
In terms of single mother households, the demographic groups most similar to Creek are Spanish American (7.0%, a difference of 0.020%), Comanche (7.0%, a difference of 0.080%), Choctaw (7.0%, a difference of 0.25%), Chickasaw (7.0%, a difference of 0.27%), and Immigrants from Burma/Myanmar (7.0%, a difference of 0.34%).
| Demographics | Rating | Rank | Single Mother Households |
| Immigrants | Micronesia | 3.6 /100 | #223 | Tragic 6.9% |
| Immigrants | Sudan | 3.5 /100 | #224 | Tragic 6.9% |
| Sudanese | 3.1 /100 | #225 | Tragic 6.9% |
| Paiute | 2.4 /100 | #226 | Tragic 7.0% |
| Kenyans | 2.3 /100 | #227 | Tragic 7.0% |
| Iroquois | 2.2 /100 | #228 | Tragic 7.0% |
| Immigrants | Kenya | 2.1 /100 | #229 | Tragic 7.0% |
| Creek | 1.6 /100 | #230 | Tragic 7.0% |
| Spanish Americans | 1.6 /100 | #231 | Tragic 7.0% |
| Comanche | 1.5 /100 | #232 | Tragic 7.0% |
| Choctaw | 1.4 /100 | #233 | Tragic 7.0% |
| Chickasaw | 1.4 /100 | #234 | Tragic 7.0% |
| Immigrants | Burma/Myanmar | 1.4 /100 | #235 | Tragic 7.0% |
| Ute | 1.0 /100 | #236 | Tragic 7.1% |
| Arapaho | 1.0 /100 | #237 | Tragic 7.1% |
Demographics Similar to Colombians by Single Mother Households
In terms of single mother households, the demographic groups most similar to Colombians are Immigrants from Uganda (6.6%, a difference of 0.010%), South American (6.6%, a difference of 0.050%), Uruguayan (6.6%, a difference of 0.050%), American (6.6%, a difference of 0.11%), and Moroccan (6.6%, a difference of 0.16%).
| Demographics | Rating | Rank | Single Mother Households |
| Costa Ricans | 24.8 /100 | #186 | Fair 6.5% |
| Immigrants | Afghanistan | 24.7 /100 | #187 | Fair 6.5% |
| Ottawa | 23.8 /100 | #188 | Fair 6.5% |
| Delaware | 23.3 /100 | #189 | Fair 6.5% |
| Peruvians | 21.6 /100 | #190 | Fair 6.5% |
| Samoans | 21.2 /100 | #191 | Fair 6.5% |
| Americans | 19.0 /100 | #192 | Poor 6.6% |
| Colombians | 18.3 /100 | #193 | Poor 6.6% |
| Immigrants | Uganda | 18.3 /100 | #194 | Poor 6.6% |
| South Americans | 18.0 /100 | #195 | Poor 6.6% |
| Uruguayans | 18.0 /100 | #196 | Poor 6.6% |
| Moroccans | 17.4 /100 | #197 | Poor 6.6% |
| Hawaiians | 16.1 /100 | #198 | Poor 6.6% |
| Potawatomi | 15.5 /100 | #199 | Poor 6.6% |
| Immigrants | Ethiopia | 14.7 /100 | #200 | Poor 6.6% |