Cree vs Scottish Average Family Size
COMPARE
Cree
Scottish
Average Family Size
Average Family Size Comparison
Cree
Scottish
3.19
AVERAGE FAMILY SIZE
6.2/ 100
METRIC RATING
225th/ 347
METRIC RANK
3.11
AVERAGE FAMILY SIZE
0.0/ 100
METRIC RATING
332nd/ 347
METRIC RANK
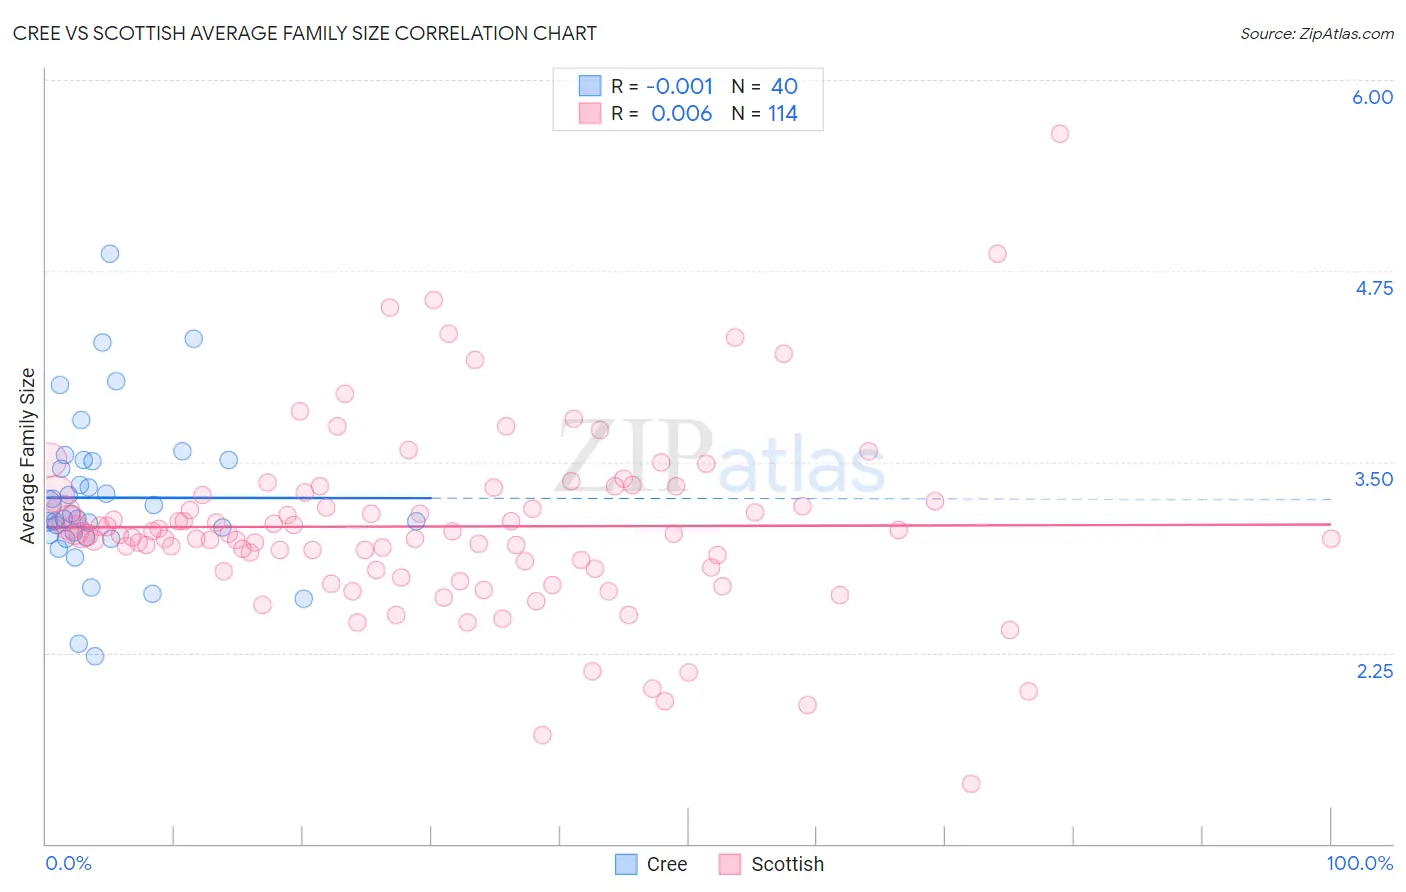
Cree vs Scottish Average Family Size Correlation Chart
The statistical analysis conducted on geographies consisting of 76,209,902 people shows no correlation between the proportion of Cree and average family size in the United States with a correlation coefficient (R) of -0.001 and weighted average of 3.19. Similarly, the statistical analysis conducted on geographies consisting of 566,567,315 people shows no correlation between the proportion of Scottish and average family size in the United States with a correlation coefficient (R) of 0.006 and weighted average of 3.11, a difference of 2.7%.
Average Family Size Correlation Summary
| Measurement | Cree | Scottish |
| Minimum | 2.23 | 1.39 |
| Maximum | 4.86 | 5.65 |
| Range | 2.63 | 4.26 |
| Mean | 3.27 | 3.08 |
| Median | 3.14 | 3.02 |
| Interquartile 25% (IQ1) | 3.01 | 2.80 |
| Interquartile 75% (IQ3) | 3.51 | 3.29 |
| Interquartile Range (IQR) | 0.49 | 0.49 |
| Standard Deviation (Sample) | 0.52 | 0.60 |
| Standard Deviation (Population) | 0.51 | 0.60 |
Similar Demographics by Average Family Size
Demographics Similar to Cree by Average Family Size
In terms of average family size, the demographic groups most similar to Cree are Syrian (3.19, a difference of 0.020%), Chickasaw (3.19, a difference of 0.020%), Portuguese (3.19, a difference of 0.020%), Nonimmigrants (3.19, a difference of 0.040%), and Immigrants from Zimbabwe (3.19, a difference of 0.060%).
| Demographics | Rating | Rank | Average Family Size |
| French American Indians | 9.8 /100 | #218 | Tragic 3.20 |
| Pennsylvania Germans | 9.3 /100 | #219 | Tragic 3.19 |
| Lebanese | 9.1 /100 | #220 | Tragic 3.19 |
| Immigrants | Ukraine | 7.2 /100 | #221 | Tragic 3.19 |
| Immigrants | Kuwait | 7.2 /100 | #222 | Tragic 3.19 |
| Immigrants | Zimbabwe | 7.1 /100 | #223 | Tragic 3.19 |
| Syrians | 6.5 /100 | #224 | Tragic 3.19 |
| Cree | 6.2 /100 | #225 | Tragic 3.19 |
| Chickasaw | 6.0 /100 | #226 | Tragic 3.19 |
| Portuguese | 6.0 /100 | #227 | Tragic 3.19 |
| Immigrants | Nonimmigrants | 5.7 /100 | #228 | Tragic 3.19 |
| Immigrants | Italy | 5.3 /100 | #229 | Tragic 3.19 |
| Icelanders | 5.2 /100 | #230 | Tragic 3.19 |
| Basques | 5.2 /100 | #231 | Tragic 3.19 |
| Cherokee | 4.7 /100 | #232 | Tragic 3.18 |
Demographics Similar to Scottish by Average Family Size
In terms of average family size, the demographic groups most similar to Scottish are Scotch-Irish (3.11, a difference of 0.0%), Latvian (3.11, a difference of 0.010%), Estonian (3.10, a difference of 0.050%), Lithuanian (3.10, a difference of 0.050%), and Belgian (3.11, a difference of 0.060%).
| Demographics | Rating | Rank | Average Family Size |
| English | 0.0 /100 | #325 | Tragic 3.11 |
| Ottawa | 0.0 /100 | #326 | Tragic 3.11 |
| Dutch | 0.0 /100 | #327 | Tragic 3.11 |
| Czechs | 0.0 /100 | #328 | Tragic 3.11 |
| Belgians | 0.0 /100 | #329 | Tragic 3.11 |
| Latvians | 0.0 /100 | #330 | Tragic 3.11 |
| Scotch-Irish | 0.0 /100 | #331 | Tragic 3.11 |
| Scottish | 0.0 /100 | #332 | Tragic 3.11 |
| Estonians | 0.0 /100 | #333 | Tragic 3.10 |
| Lithuanians | 0.0 /100 | #334 | Tragic 3.10 |
| Luxembourgers | 0.0 /100 | #335 | Tragic 3.10 |
| Irish | 0.0 /100 | #336 | Tragic 3.10 |
| Swedes | 0.0 /100 | #337 | Tragic 3.10 |
| French | 0.0 /100 | #338 | Tragic 3.10 |
| Croatians | 0.0 /100 | #339 | Tragic 3.10 |