Cree vs Apache Single Mother Households
COMPARE
Cree
Apache
Single Mother Households
Single Mother Households Comparison
Cree
Apache
6.7%
SINGLE MOTHER HOUSEHOLDS
11.9/ 100
METRIC RATING
205th/ 347
METRIC RANK
7.9%
SINGLE MOTHER HOUSEHOLDS
0.0/ 100
METRIC RATING
294th/ 347
METRIC RANK
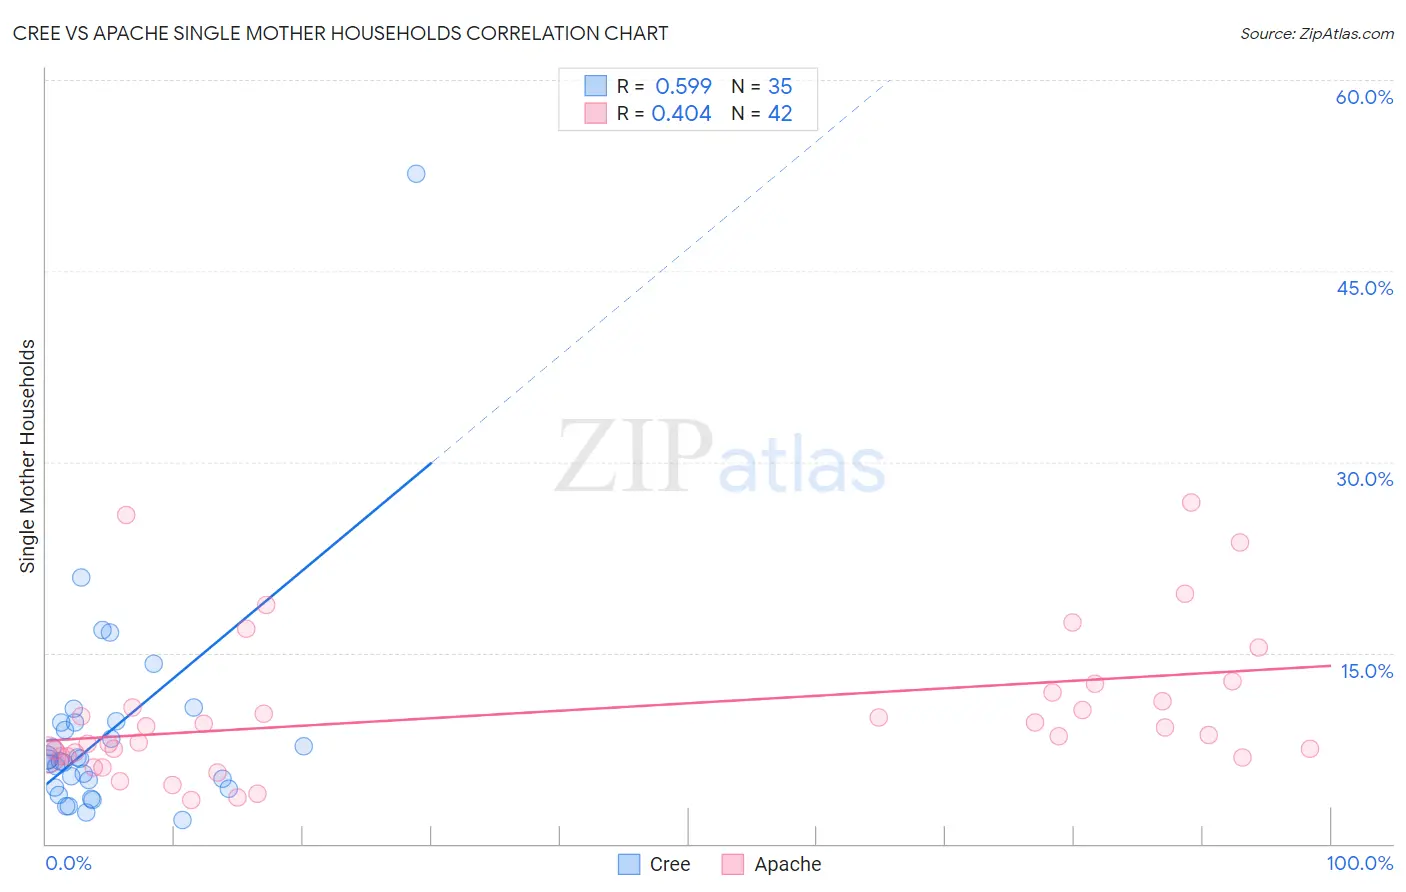
Cree vs Apache Single Mother Households Correlation Chart
The statistical analysis conducted on geographies consisting of 76,173,088 people shows a substantial positive correlation between the proportion of Cree and percentage of single mother households in the United States with a correlation coefficient (R) of 0.599 and weighted average of 6.7%. Similarly, the statistical analysis conducted on geographies consisting of 230,770,959 people shows a moderate positive correlation between the proportion of Apache and percentage of single mother households in the United States with a correlation coefficient (R) of 0.404 and weighted average of 7.9%, a difference of 18.4%.
Single Mother Households Correlation Summary
| Measurement | Cree | Apache |
| Minimum | 1.9% | 3.4% |
| Maximum | 52.6% | 26.8% |
| Range | 50.8% | 23.4% |
| Mean | 8.7% | 10.4% |
| Median | 6.6% | 8.8% |
| Interquartile 25% (IQ1) | 4.4% | 6.9% |
| Interquartile 75% (IQ3) | 9.5% | 11.8% |
| Interquartile Range (IQR) | 5.1% | 5.0% |
| Standard Deviation (Sample) | 8.7% | 5.7% |
| Standard Deviation (Population) | 8.6% | 5.7% |
Similar Demographics by Single Mother Households
Demographics Similar to Cree by Single Mother Households
In terms of single mother households, the demographic groups most similar to Cree are Immigrants from Fiji (6.7%, a difference of 0.020%), Immigrants from Peru (6.7%, a difference of 0.030%), German Russian (6.7%, a difference of 0.080%), Immigrants from South America (6.7%, a difference of 0.080%), and Guamanian/Chamorro (6.6%, a difference of 0.13%).
| Demographics | Rating | Rank | Single Mother Households |
| Hawaiians | 16.1 /100 | #198 | Poor 6.6% |
| Potawatomi | 15.5 /100 | #199 | Poor 6.6% |
| Immigrants | Ethiopia | 14.7 /100 | #200 | Poor 6.6% |
| Venezuelans | 12.9 /100 | #201 | Poor 6.6% |
| Guamanians/Chamorros | 12.4 /100 | #202 | Poor 6.6% |
| Immigrants | Peru | 12.0 /100 | #203 | Poor 6.7% |
| Immigrants | Fiji | 11.9 /100 | #204 | Poor 6.7% |
| Cree | 11.9 /100 | #205 | Poor 6.7% |
| German Russians | 11.5 /100 | #206 | Poor 6.7% |
| Immigrants | South America | 11.5 /100 | #207 | Poor 6.7% |
| Vietnamese | 11.3 /100 | #208 | Poor 6.7% |
| Immigrants | Colombia | 10.5 /100 | #209 | Poor 6.7% |
| Immigrants | Nonimmigrants | 10.4 /100 | #210 | Poor 6.7% |
| Immigrants | Venezuela | 8.5 /100 | #211 | Tragic 6.7% |
| Immigrants | Eritrea | 8.4 /100 | #212 | Tragic 6.7% |
Demographics Similar to Apache by Single Mother Households
In terms of single mother households, the demographic groups most similar to Apache are Immigrants from Cameroon (7.9%, a difference of 0.10%), Barbadian (7.9%, a difference of 0.29%), Immigrants from Latin America (7.9%, a difference of 0.35%), Hispanic or Latino (7.9%, a difference of 0.39%), and Ghanaian (7.8%, a difference of 0.46%).
| Demographics | Rating | Rank | Single Mother Households |
| Immigrants | Guatemala | 0.0 /100 | #287 | Tragic 7.7% |
| Sierra Leoneans | 0.0 /100 | #288 | Tragic 7.7% |
| Sub-Saharan Africans | 0.0 /100 | #289 | Tragic 7.8% |
| Immigrants | Nigeria | 0.0 /100 | #290 | Tragic 7.8% |
| West Indians | 0.0 /100 | #291 | Tragic 7.8% |
| Ghanaians | 0.0 /100 | #292 | Tragic 7.8% |
| Immigrants | Cameroon | 0.0 /100 | #293 | Tragic 7.9% |
| Apache | 0.0 /100 | #294 | Tragic 7.9% |
| Barbadians | 0.0 /100 | #295 | Tragic 7.9% |
| Immigrants | Latin America | 0.0 /100 | #296 | Tragic 7.9% |
| Hispanics or Latinos | 0.0 /100 | #297 | Tragic 7.9% |
| Immigrants | West Indies | 0.0 /100 | #298 | Tragic 7.9% |
| Houma | 0.0 /100 | #299 | Tragic 7.9% |
| Mexicans | 0.0 /100 | #300 | Tragic 8.0% |
| Chippewa | 0.0 /100 | #301 | Tragic 8.0% |