Costa Rican vs Immigrants from Netherlands Single Father Households
COMPARE
Costa Rican
Immigrants from Netherlands
Single Father Households
Single Father Households Comparison
Costa Ricans
Immigrants from Netherlands
2.3%
SINGLE FATHER HOUSEHOLDS
44.1/ 100
METRIC RATING
178th/ 347
METRIC RANK
2.2%
SINGLE FATHER HOUSEHOLDS
98.5/ 100
METRIC RATING
108th/ 347
METRIC RANK
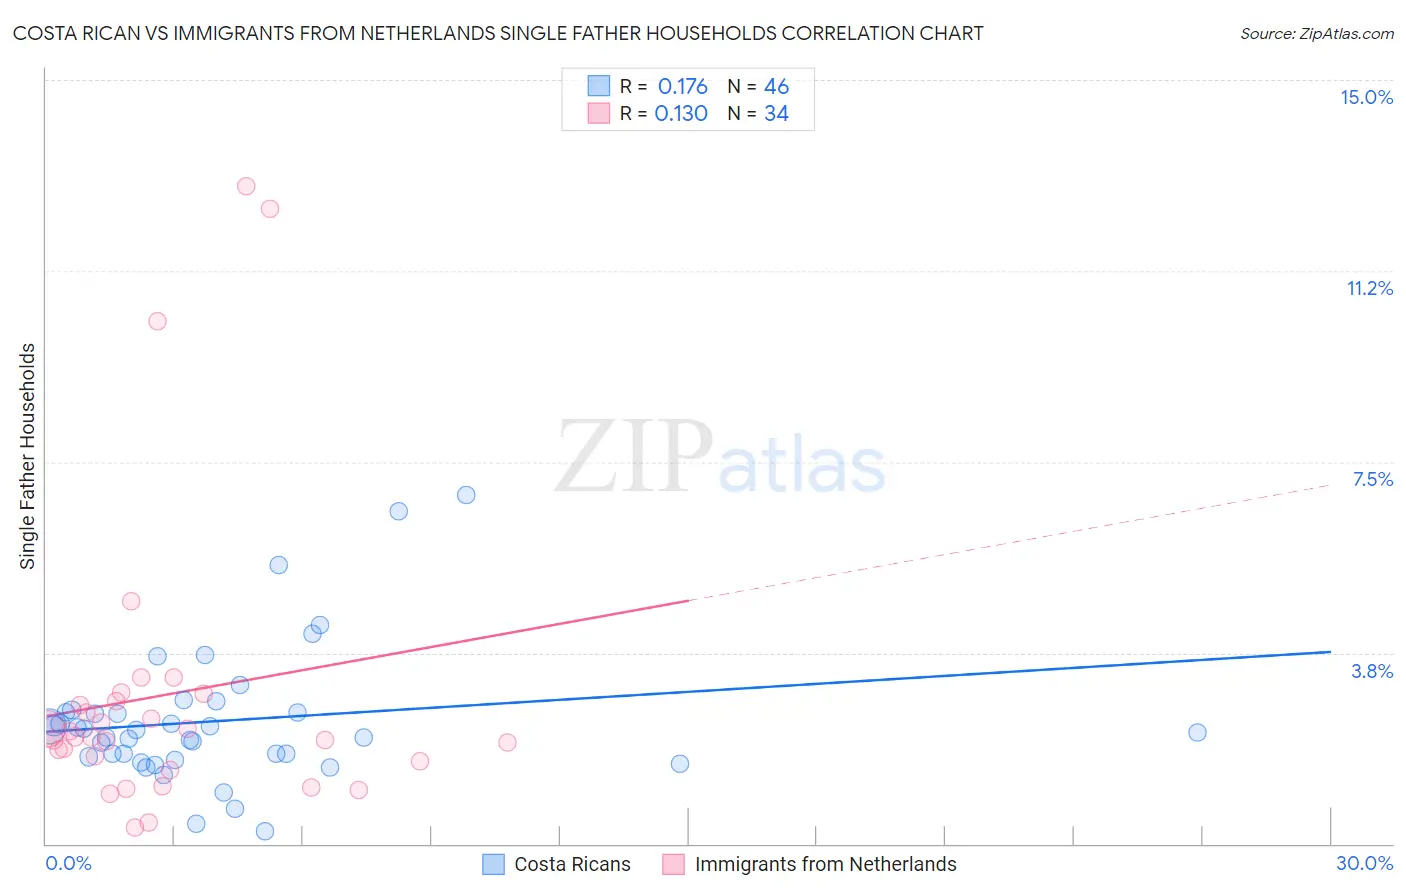
Costa Rican vs Immigrants from Netherlands Single Father Households Correlation Chart
The statistical analysis conducted on geographies consisting of 252,556,792 people shows a poor positive correlation between the proportion of Costa Ricans and percentage of single father households in the United States with a correlation coefficient (R) of 0.176 and weighted average of 2.3%. Similarly, the statistical analysis conducted on geographies consisting of 236,298,420 people shows a poor positive correlation between the proportion of Immigrants from Netherlands and percentage of single father households in the United States with a correlation coefficient (R) of 0.130 and weighted average of 2.2%, a difference of 8.7%.
Single Father Households Correlation Summary
| Measurement | Costa Rican | Immigrants from Netherlands |
| Minimum | 0.25% | 0.33% |
| Maximum | 6.9% | 12.9% |
| Range | 6.6% | 12.6% |
| Mean | 2.4% | 2.9% |
| Median | 2.2% | 2.1% |
| Interquartile 25% (IQ1) | 1.7% | 1.6% |
| Interquartile 75% (IQ3) | 2.6% | 2.8% |
| Interquartile Range (IQR) | 0.87% | 1.2% |
| Standard Deviation (Sample) | 1.3% | 3.0% |
| Standard Deviation (Population) | 1.3% | 2.9% |
Similar Demographics by Single Father Households
Demographics Similar to Costa Ricans by Single Father Households
In terms of single father households, the demographic groups most similar to Costa Ricans are Welsh (2.3%, a difference of 0.0%), Yugoslavian (2.3%, a difference of 0.020%), Jamaican (2.3%, a difference of 0.040%), Belgian (2.3%, a difference of 0.060%), and Immigrants from Panama (2.4%, a difference of 0.17%).
| Demographics | Rating | Rank | Single Father Households |
| Swedes | 61.6 /100 | #171 | Good 2.3% |
| Czechoslovakians | 58.9 /100 | #172 | Average 2.3% |
| Celtics | 55.4 /100 | #173 | Average 2.3% |
| Afghans | 50.0 /100 | #174 | Average 2.3% |
| Immigrants | Jamaica | 49.1 /100 | #175 | Average 2.3% |
| Danes | 48.2 /100 | #176 | Average 2.3% |
| Colombians | 48.0 /100 | #177 | Average 2.3% |
| Costa Ricans | 44.1 /100 | #178 | Average 2.3% |
| Welsh | 44.0 /100 | #179 | Average 2.3% |
| Yugoslavians | 43.9 /100 | #180 | Average 2.3% |
| Jamaicans | 43.5 /100 | #181 | Average 2.3% |
| Belgians | 43.3 /100 | #182 | Average 2.3% |
| Immigrants | Panama | 41.8 /100 | #183 | Average 2.4% |
| Sri Lankans | 41.8 /100 | #184 | Average 2.4% |
| Nigerians | 41.0 /100 | #185 | Average 2.4% |
Demographics Similar to Immigrants from Netherlands by Single Father Households
In terms of single father households, the demographic groups most similar to Immigrants from Netherlands are Slovene (2.2%, a difference of 0.020%), Barbadian (2.2%, a difference of 0.040%), Immigrants from Southern Europe (2.2%, a difference of 0.14%), Italian (2.2%, a difference of 0.16%), and Immigrants from Canada (2.2%, a difference of 0.24%).
| Demographics | Rating | Rank | Single Father Households |
| Immigrants | Western Europe | 98.9 /100 | #101 | Exceptional 2.1% |
| Argentineans | 98.9 /100 | #102 | Exceptional 2.1% |
| Lebanese | 98.9 /100 | #103 | Exceptional 2.1% |
| Alsatians | 98.9 /100 | #104 | Exceptional 2.1% |
| Palestinians | 98.6 /100 | #105 | Exceptional 2.2% |
| Immigrants | Southern Europe | 98.6 /100 | #106 | Exceptional 2.2% |
| Slovenes | 98.5 /100 | #107 | Exceptional 2.2% |
| Immigrants | Netherlands | 98.5 /100 | #108 | Exceptional 2.2% |
| Barbadians | 98.4 /100 | #109 | Exceptional 2.2% |
| Italians | 98.3 /100 | #110 | Exceptional 2.2% |
| Immigrants | Canada | 98.3 /100 | #111 | Exceptional 2.2% |
| Immigrants | Trinidad and Tobago | 98.2 /100 | #112 | Exceptional 2.2% |
| Iraqis | 98.2 /100 | #113 | Exceptional 2.2% |
| Immigrants | North America | 98.2 /100 | #114 | Exceptional 2.2% |
| Immigrants | Barbados | 98.2 /100 | #115 | Exceptional 2.2% |