Colombian vs Mexican Divorced or Separated
COMPARE
Colombian
Mexican
Divorced or Separated
Divorced or Separated Comparison
Colombians
Mexicans
12.4%
DIVORCED OR SEPARATED
4.2/ 100
METRIC RATING
236th/ 347
METRIC RANK
12.2%
DIVORCED OR SEPARATED
21.0/ 100
METRIC RATING
207th/ 347
METRIC RANK
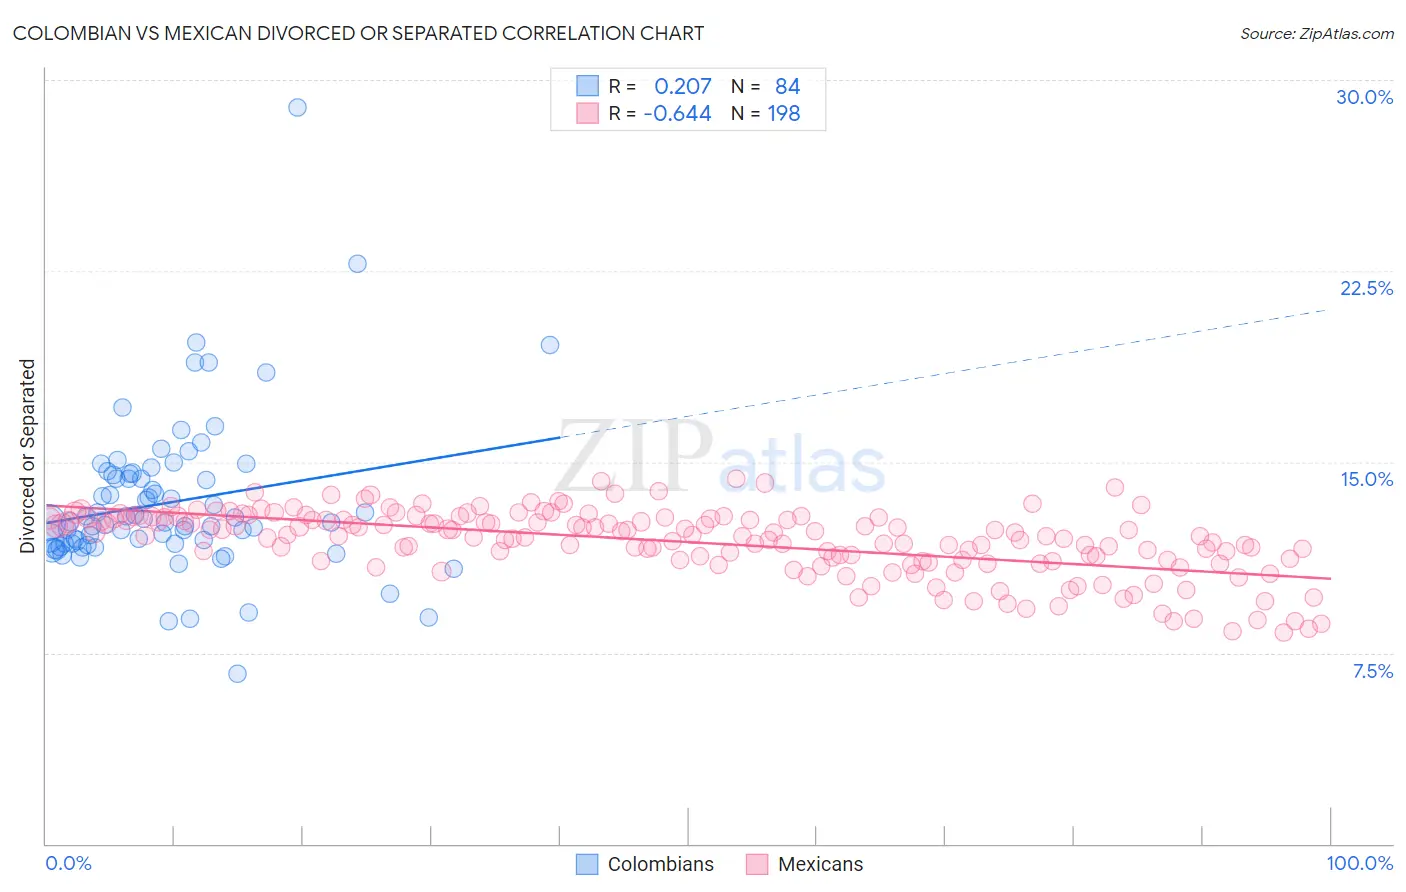
Colombian vs Mexican Divorced or Separated Correlation Chart
The statistical analysis conducted on geographies consisting of 419,450,330 people shows a weak positive correlation between the proportion of Colombians and percentage of population currently divorced or separated in the United States with a correlation coefficient (R) of 0.207 and weighted average of 12.4%. Similarly, the statistical analysis conducted on geographies consisting of 564,740,181 people shows a significant negative correlation between the proportion of Mexicans and percentage of population currently divorced or separated in the United States with a correlation coefficient (R) of -0.644 and weighted average of 12.2%, a difference of 1.5%.
Divorced or Separated Correlation Summary
| Measurement | Colombian | Mexican |
| Minimum | 6.7% | 8.3% |
| Maximum | 28.9% | 14.3% |
| Range | 22.2% | 6.1% |
| Mean | 13.4% | 11.9% |
| Median | 12.6% | 12.1% |
| Interquartile 25% (IQ1) | 11.8% | 11.1% |
| Interquartile 75% (IQ3) | 14.5% | 12.8% |
| Interquartile Range (IQR) | 2.8% | 1.6% |
| Standard Deviation (Sample) | 3.1% | 1.3% |
| Standard Deviation (Population) | 3.1% | 1.3% |
Similar Demographics by Divorced or Separated
Demographics Similar to Colombians by Divorced or Separated
In terms of divorced or separated, the demographic groups most similar to Colombians are Immigrants from Laos (12.4%, a difference of 0.0%), Immigrants from Bosnia and Herzegovina (12.4%, a difference of 0.030%), West Indian (12.4%, a difference of 0.040%), Sudanese (12.4%, a difference of 0.040%), and Immigrants from Germany (12.4%, a difference of 0.040%).
| Demographics | Rating | Rank | Divorced or Separated |
| Immigrants | Sudan | 8.2 /100 | #229 | Tragic 12.3% |
| Yakama | 7.8 /100 | #230 | Tragic 12.3% |
| Yugoslavians | 6.6 /100 | #231 | Tragic 12.3% |
| Canadians | 5.3 /100 | #232 | Tragic 12.4% |
| Malaysians | 4.8 /100 | #233 | Tragic 12.4% |
| West Indians | 4.4 /100 | #234 | Tragic 12.4% |
| Immigrants | Bosnia and Herzegovina | 4.3 /100 | #235 | Tragic 12.4% |
| Colombians | 4.2 /100 | #236 | Tragic 12.4% |
| Immigrants | Laos | 4.2 /100 | #237 | Tragic 12.4% |
| Sudanese | 4.0 /100 | #238 | Tragic 12.4% |
| Immigrants | Germany | 4.0 /100 | #239 | Tragic 12.4% |
| British West Indians | 3.7 /100 | #240 | Tragic 12.4% |
| Uruguayans | 3.4 /100 | #241 | Tragic 12.4% |
| Dutch | 3.1 /100 | #242 | Tragic 12.4% |
| Immigrants | Latin America | 2.8 /100 | #243 | Tragic 12.4% |
Demographics Similar to Mexicans by Divorced or Separated
In terms of divorced or separated, the demographic groups most similar to Mexicans are Slovak (12.2%, a difference of 0.0%), Immigrants from Costa Rica (12.2%, a difference of 0.010%), Kenyan (12.2%, a difference of 0.040%), Immigrants from Guatemala (12.2%, a difference of 0.11%), and Immigrants from Ghana (12.2%, a difference of 0.12%).
| Demographics | Rating | Rank | Divorced or Separated |
| South Americans | 28.6 /100 | #200 | Fair 12.2% |
| Guatemalans | 26.9 /100 | #201 | Fair 12.2% |
| Portuguese | 23.5 /100 | #202 | Fair 12.2% |
| Immigrants | Guatemala | 23.2 /100 | #203 | Fair 12.2% |
| Kenyans | 21.8 /100 | #204 | Fair 12.2% |
| Immigrants | Costa Rica | 21.3 /100 | #205 | Fair 12.2% |
| Slovaks | 21.0 /100 | #206 | Fair 12.2% |
| Mexicans | 21.0 /100 | #207 | Fair 12.2% |
| Immigrants | Ghana | 18.8 /100 | #208 | Poor 12.2% |
| Immigrants | Trinidad and Tobago | 17.8 /100 | #209 | Poor 12.2% |
| Slavs | 17.0 /100 | #210 | Poor 12.2% |
| Trinidadians and Tobagonians | 16.6 /100 | #211 | Poor 12.2% |
| Immigrants | Kenya | 16.5 /100 | #212 | Poor 12.2% |
| Immigrants | Eastern Africa | 16.2 /100 | #213 | Poor 12.2% |
| Immigrants | Argentina | 15.5 /100 | #214 | Poor 12.2% |