Colombian vs Immigrants from Sri Lanka Single Father Households
COMPARE
Colombian
Immigrants from Sri Lanka
Single Father Households
Single Father Households Comparison
Colombians
Immigrants from Sri Lanka
2.3%
SINGLE FATHER HOUSEHOLDS
48.0/ 100
METRIC RATING
177th/ 347
METRIC RANK
2.0%
SINGLE FATHER HOUSEHOLDS
100.0/ 100
METRIC RATING
39th/ 347
METRIC RANK
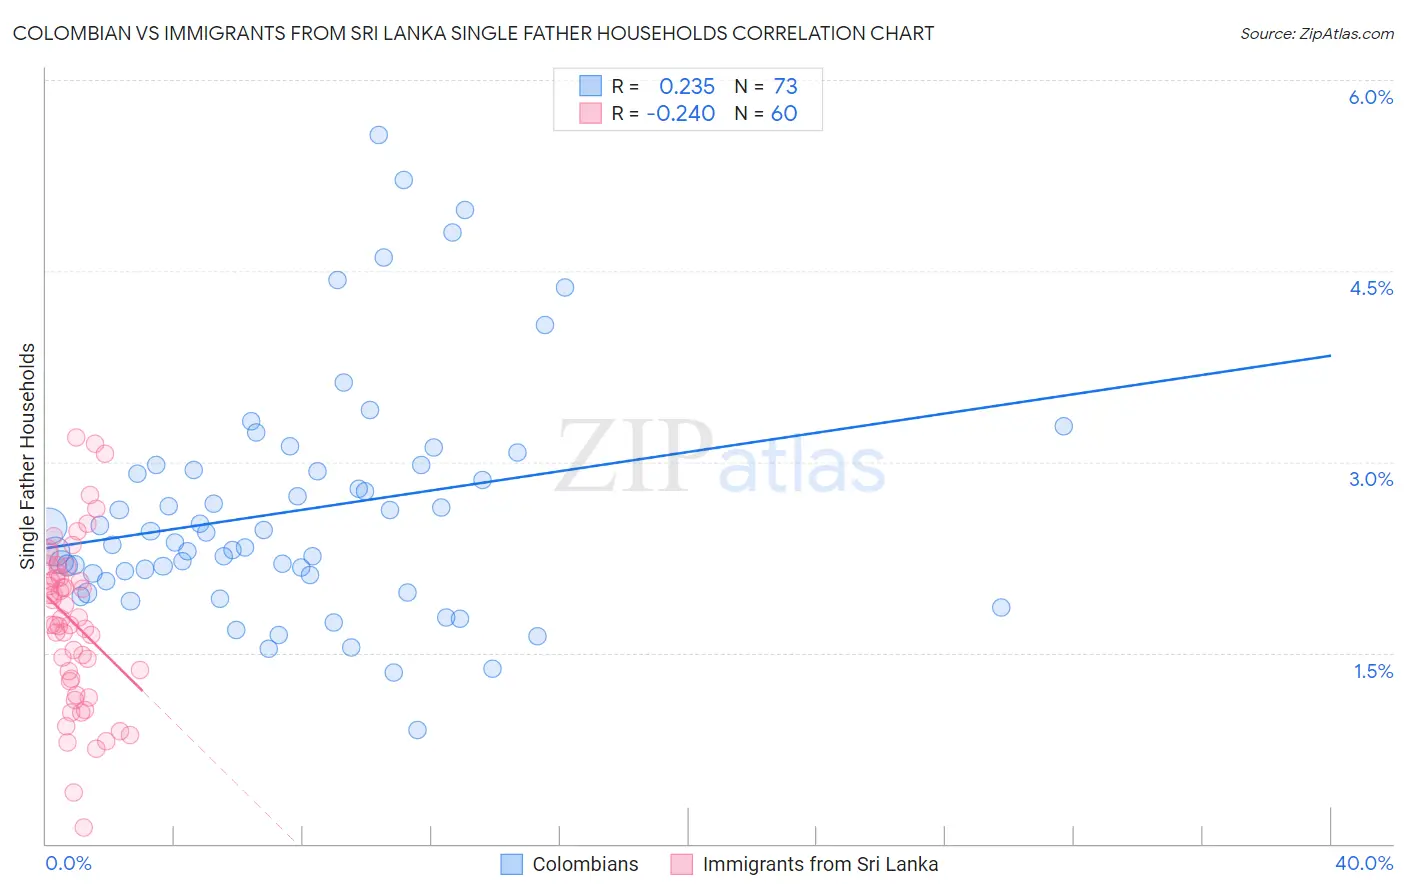
Colombian vs Immigrants from Sri Lanka Single Father Households Correlation Chart
The statistical analysis conducted on geographies consisting of 415,821,309 people shows a weak positive correlation between the proportion of Colombians and percentage of single father households in the United States with a correlation coefficient (R) of 0.235 and weighted average of 2.3%. Similarly, the statistical analysis conducted on geographies consisting of 149,256,375 people shows a weak negative correlation between the proportion of Immigrants from Sri Lanka and percentage of single father households in the United States with a correlation coefficient (R) of -0.240 and weighted average of 2.0%, a difference of 17.5%.
Single Father Households Correlation Summary
| Measurement | Colombian | Immigrants from Sri Lanka |
| Minimum | 0.89% | 0.13% |
| Maximum | 5.6% | 3.2% |
| Range | 4.7% | 3.1% |
| Mean | 2.6% | 1.7% |
| Median | 2.4% | 1.7% |
| Interquartile 25% (IQ1) | 2.1% | 1.3% |
| Interquartile 75% (IQ3) | 3.0% | 2.1% |
| Interquartile Range (IQR) | 0.87% | 0.83% |
| Standard Deviation (Sample) | 0.93% | 0.65% |
| Standard Deviation (Population) | 0.92% | 0.64% |
Similar Demographics by Single Father Households
Demographics Similar to Colombians by Single Father Households
In terms of single father households, the demographic groups most similar to Colombians are Danish (2.3%, a difference of 0.010%), Immigrants from Jamaica (2.3%, a difference of 0.080%), Afghan (2.3%, a difference of 0.14%), Costa Rican (2.3%, a difference of 0.29%), and Welsh (2.3%, a difference of 0.30%).
| Demographics | Rating | Rank | Single Father Households |
| Ugandans | 62.2 /100 | #170 | Good 2.3% |
| Swedes | 61.6 /100 | #171 | Good 2.3% |
| Czechoslovakians | 58.9 /100 | #172 | Average 2.3% |
| Celtics | 55.4 /100 | #173 | Average 2.3% |
| Afghans | 50.0 /100 | #174 | Average 2.3% |
| Immigrants | Jamaica | 49.1 /100 | #175 | Average 2.3% |
| Danes | 48.2 /100 | #176 | Average 2.3% |
| Colombians | 48.0 /100 | #177 | Average 2.3% |
| Costa Ricans | 44.1 /100 | #178 | Average 2.3% |
| Welsh | 44.0 /100 | #179 | Average 2.3% |
| Yugoslavians | 43.9 /100 | #180 | Average 2.3% |
| Jamaicans | 43.5 /100 | #181 | Average 2.3% |
| Belgians | 43.3 /100 | #182 | Average 2.3% |
| Immigrants | Panama | 41.8 /100 | #183 | Average 2.4% |
| Sri Lankans | 41.8 /100 | #184 | Average 2.4% |
Demographics Similar to Immigrants from Sri Lanka by Single Father Households
In terms of single father households, the demographic groups most similar to Immigrants from Sri Lanka are Immigrants from Eastern Europe (2.0%, a difference of 0.0%), Immigrants from Bulgaria (2.0%, a difference of 0.050%), Immigrants from Turkey (2.0%, a difference of 0.23%), Immigrants from St. Vincent and the Grenadines (2.0%, a difference of 0.30%), and Immigrants from Belgium (2.0%, a difference of 0.32%).
| Demographics | Rating | Rank | Single Father Households |
| Chinese | 100.0 /100 | #32 | Exceptional 2.0% |
| Turks | 100.0 /100 | #33 | Exceptional 2.0% |
| Immigrants | Australia | 100.0 /100 | #34 | Exceptional 2.0% |
| Albanians | 100.0 /100 | #35 | Exceptional 2.0% |
| Immigrants | Belgium | 100.0 /100 | #36 | Exceptional 2.0% |
| Immigrants | St. Vincent and the Grenadines | 100.0 /100 | #37 | Exceptional 2.0% |
| Immigrants | Eastern Europe | 100.0 /100 | #38 | Exceptional 2.0% |
| Immigrants | Sri Lanka | 100.0 /100 | #39 | Exceptional 2.0% |
| Immigrants | Bulgaria | 100.0 /100 | #40 | Exceptional 2.0% |
| Immigrants | Turkey | 100.0 /100 | #41 | Exceptional 2.0% |
| Macedonians | 100.0 /100 | #42 | Exceptional 2.0% |
| Immigrants | Grenada | 100.0 /100 | #43 | Exceptional 2.0% |
| Latvians | 100.0 /100 | #44 | Exceptional 2.0% |
| Russians | 100.0 /100 | #45 | Exceptional 2.0% |
| Immigrants | Lebanon | 100.0 /100 | #46 | Exceptional 2.0% |