Choctaw vs Central American Single Father Households
COMPARE
Choctaw
Central American
Single Father Households
Single Father Households Comparison
Choctaw
Central Americans
2.7%
SINGLE FATHER HOUSEHOLDS
0.0/ 100
METRIC RATING
292nd/ 347
METRIC RANK
2.9%
SINGLE FATHER HOUSEHOLDS
0.0/ 100
METRIC RATING
309th/ 347
METRIC RANK
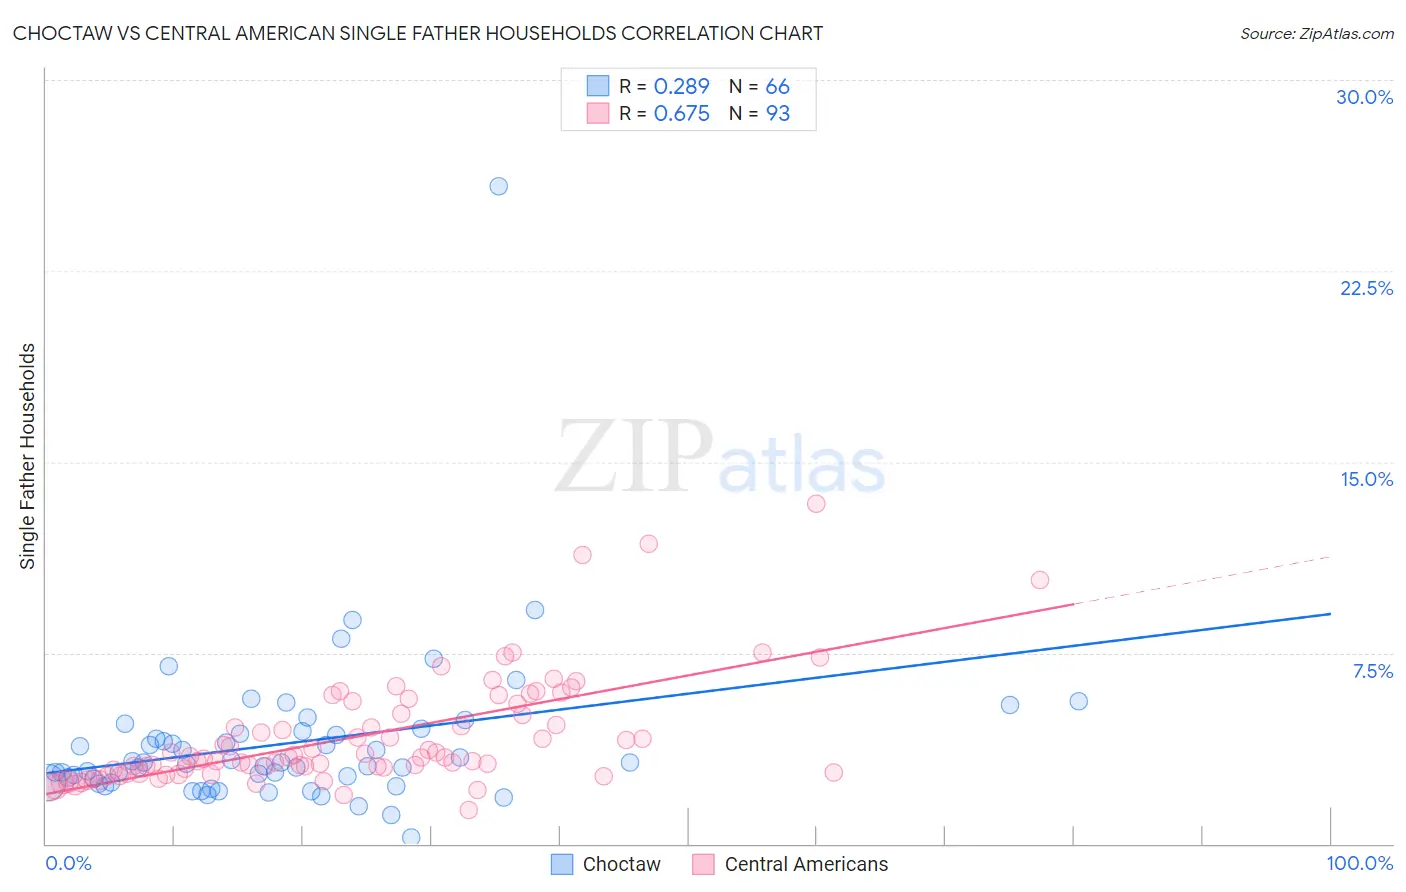
Choctaw vs Central American Single Father Households Correlation Chart
The statistical analysis conducted on geographies consisting of 267,840,936 people shows a weak positive correlation between the proportion of Choctaw and percentage of single father households in the United States with a correlation coefficient (R) of 0.289 and weighted average of 2.7%. Similarly, the statistical analysis conducted on geographies consisting of 497,759,507 people shows a significant positive correlation between the proportion of Central Americans and percentage of single father households in the United States with a correlation coefficient (R) of 0.675 and weighted average of 2.9%, a difference of 5.2%.
Single Father Households Correlation Summary
| Measurement | Choctaw | Central American |
| Minimum | 0.27% | 1.3% |
| Maximum | 25.8% | 13.4% |
| Range | 25.5% | 12.0% |
| Mean | 3.9% | 4.2% |
| Median | 3.2% | 3.4% |
| Interquartile 25% (IQ1) | 2.4% | 2.8% |
| Interquartile 75% (IQ3) | 4.3% | 5.3% |
| Interquartile Range (IQR) | 1.9% | 2.5% |
| Standard Deviation (Sample) | 3.2% | 2.2% |
| Standard Deviation (Population) | 3.2% | 2.2% |
Demographics Similar to Choctaw and Central Americans by Single Father Households
In terms of single father households, the demographic groups most similar to Choctaw are Immigrants from Fiji (2.7%, a difference of 0.16%), Blackfeet (2.7%, a difference of 0.46%), Malaysian (2.7%, a difference of 0.59%), Puget Sound Salish (2.7%, a difference of 1.0%), and Chickasaw (2.8%, a difference of 1.4%). Similarly, the demographic groups most similar to Central Americans are Immigrants from Laos (2.9%, a difference of 0.21%), Apache (2.8%, a difference of 0.71%), Hopi (2.8%, a difference of 0.89%), Immigrants from the Azores (2.8%, a difference of 1.1%), and Hispanic or Latino (2.8%, a difference of 1.2%).
| Demographics | Rating | Rank | Single Father Households |
| Puget Sound Salish | 0.0 /100 | #290 | Tragic 2.7% |
| Blackfeet | 0.0 /100 | #291 | Tragic 2.7% |
| Choctaw | 0.0 /100 | #292 | Tragic 2.7% |
| Immigrants | Fiji | 0.0 /100 | #293 | Tragic 2.7% |
| Malaysians | 0.0 /100 | #294 | Tragic 2.7% |
| Chickasaw | 0.0 /100 | #295 | Tragic 2.8% |
| Japanese | 0.0 /100 | #296 | Tragic 2.8% |
| Hondurans | 0.0 /100 | #297 | Tragic 2.8% |
| Cree | 0.0 /100 | #298 | Tragic 2.8% |
| Lumbee | 0.0 /100 | #299 | Tragic 2.8% |
| Kiowa | 0.0 /100 | #300 | Tragic 2.8% |
| Immigrants | Latin America | 0.0 /100 | #301 | Tragic 2.8% |
| Spanish Americans | 0.0 /100 | #302 | Tragic 2.8% |
| Immigrants | Honduras | 0.0 /100 | #303 | Tragic 2.8% |
| Mexican American Indians | 0.0 /100 | #304 | Tragic 2.8% |
| Hispanics or Latinos | 0.0 /100 | #305 | Tragic 2.8% |
| Immigrants | Azores | 0.0 /100 | #306 | Tragic 2.8% |
| Hopi | 0.0 /100 | #307 | Tragic 2.8% |
| Apache | 0.0 /100 | #308 | Tragic 2.8% |
| Central Americans | 0.0 /100 | #309 | Tragic 2.9% |
| Immigrants | Laos | 0.0 /100 | #310 | Tragic 2.9% |