Chippewa vs Pakistani Divorced or Separated
COMPARE
Chippewa
Pakistani
Divorced or Separated
Divorced or Separated Comparison
Chippewa
Pakistanis
13.2%
DIVORCED OR SEPARATED
0.0/ 100
METRIC RATING
305th/ 347
METRIC RANK
11.9%
DIVORCED OR SEPARATED
81.3/ 100
METRIC RATING
143rd/ 347
METRIC RANK
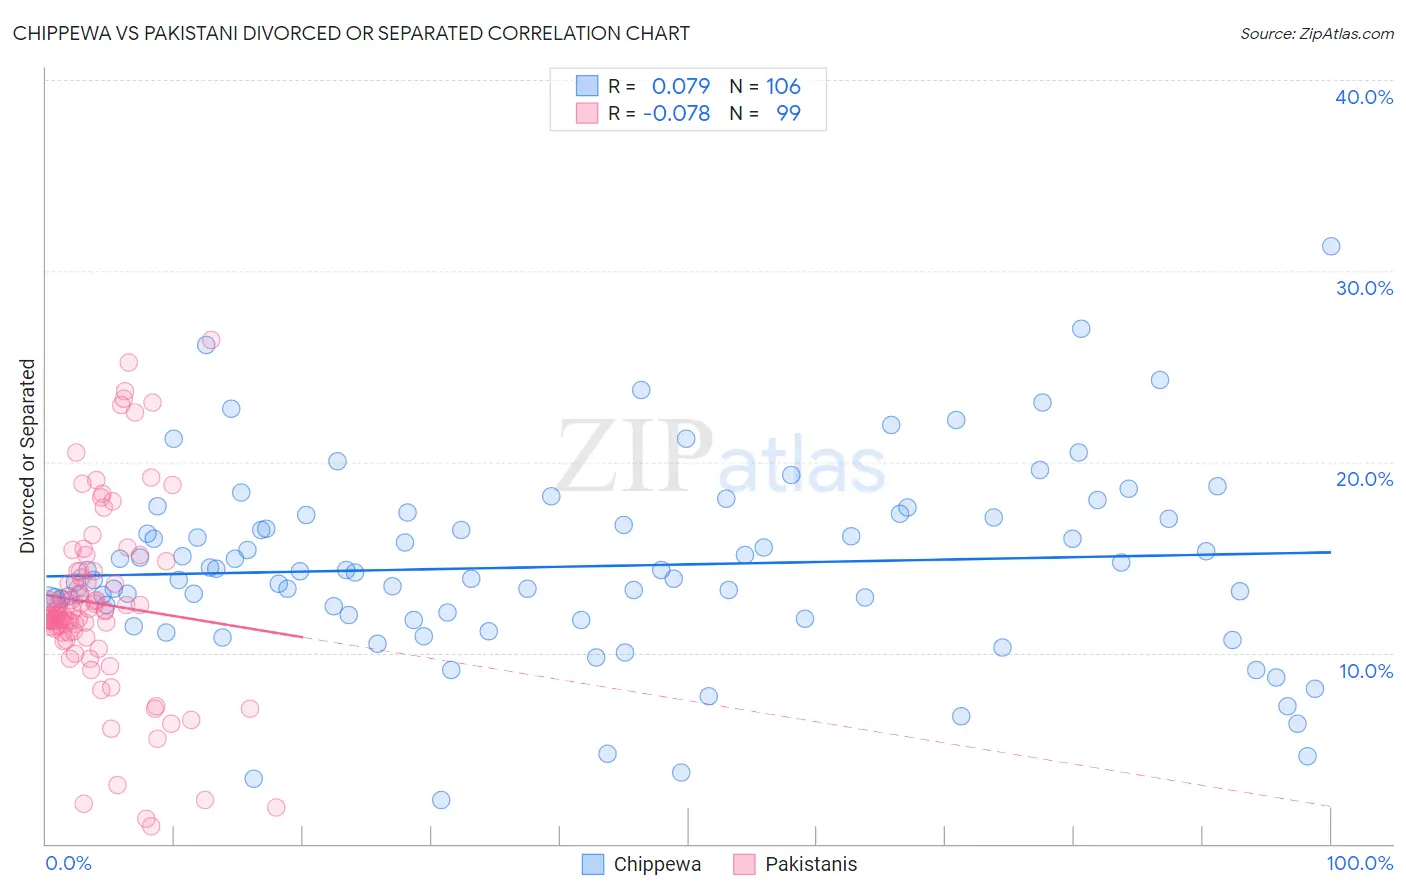
Chippewa vs Pakistani Divorced or Separated Correlation Chart
The statistical analysis conducted on geographies consisting of 215,036,643 people shows a slight positive correlation between the proportion of Chippewa and percentage of population currently divorced or separated in the United States with a correlation coefficient (R) of 0.079 and weighted average of 13.2%. Similarly, the statistical analysis conducted on geographies consisting of 335,267,594 people shows a slight negative correlation between the proportion of Pakistanis and percentage of population currently divorced or separated in the United States with a correlation coefficient (R) of -0.078 and weighted average of 11.9%, a difference of 10.6%.
Divorced or Separated Correlation Summary
| Measurement | Chippewa | Pakistani |
| Minimum | 2.3% | 0.90% |
| Maximum | 31.3% | 26.4% |
| Range | 29.0% | 25.5% |
| Mean | 14.5% | 12.6% |
| Median | 14.2% | 12.1% |
| Interquartile 25% (IQ1) | 12.0% | 11.0% |
| Interquartile 75% (IQ3) | 17.1% | 14.3% |
| Interquartile Range (IQR) | 5.1% | 3.2% |
| Standard Deviation (Sample) | 4.9% | 4.9% |
| Standard Deviation (Population) | 4.9% | 4.9% |
Similar Demographics by Divorced or Separated
Demographics Similar to Chippewa by Divorced or Separated
In terms of divorced or separated, the demographic groups most similar to Chippewa are Hopi (13.2%, a difference of 0.050%), Tlingit-Haida (13.2%, a difference of 0.16%), Cape Verdean (13.1%, a difference of 0.18%), Immigrants from Venezuela (13.1%, a difference of 0.20%), and Alaskan Athabascan (13.1%, a difference of 0.30%).
| Demographics | Rating | Rank | Divorced or Separated |
| Venezuelans | 0.0 /100 | #298 | Tragic 13.0% |
| Immigrants | Jamaica | 0.0 /100 | #299 | Tragic 13.0% |
| Immigrants | Cabo Verde | 0.0 /100 | #300 | Tragic 13.1% |
| Alaskan Athabascans | 0.0 /100 | #301 | Tragic 13.1% |
| Immigrants | Venezuela | 0.0 /100 | #302 | Tragic 13.1% |
| Cape Verdeans | 0.0 /100 | #303 | Tragic 13.1% |
| Hopi | 0.0 /100 | #304 | Tragic 13.2% |
| Chippewa | 0.0 /100 | #305 | Tragic 13.2% |
| Tlingit-Haida | 0.0 /100 | #306 | Tragic 13.2% |
| French American Indians | 0.0 /100 | #307 | Tragic 13.2% |
| Ottawa | 0.0 /100 | #308 | Tragic 13.2% |
| Americans | 0.0 /100 | #309 | Tragic 13.2% |
| Africans | 0.0 /100 | #310 | Tragic 13.2% |
| Sioux | 0.0 /100 | #311 | Tragic 13.2% |
| Blackfeet | 0.0 /100 | #312 | Tragic 13.3% |
Demographics Similar to Pakistanis by Divorced or Separated
In terms of divorced or separated, the demographic groups most similar to Pakistanis are Immigrants from Zimbabwe (11.9%, a difference of 0.010%), Peruvian (11.9%, a difference of 0.030%), Croatian (11.9%, a difference of 0.050%), Immigrants from Morocco (11.9%, a difference of 0.090%), and Lebanese (11.9%, a difference of 0.12%).
| Demographics | Rating | Rank | Divorced or Separated |
| Carpatho Rusyns | 84.8 /100 | #136 | Excellent 11.9% |
| Alsatians | 84.0 /100 | #137 | Excellent 11.9% |
| Immigrants | Netherlands | 83.9 /100 | #138 | Excellent 11.9% |
| Australians | 83.6 /100 | #139 | Excellent 11.9% |
| Lebanese | 83.4 /100 | #140 | Excellent 11.9% |
| Immigrants | Morocco | 82.9 /100 | #141 | Excellent 11.9% |
| Immigrants | Zimbabwe | 81.5 /100 | #142 | Excellent 11.9% |
| Pakistanis | 81.3 /100 | #143 | Excellent 11.9% |
| Peruvians | 80.9 /100 | #144 | Excellent 11.9% |
| Croatians | 80.6 /100 | #145 | Excellent 11.9% |
| Immigrants | Grenada | 79.1 /100 | #146 | Good 11.9% |
| Poles | 78.6 /100 | #147 | Good 11.9% |
| Italians | 77.8 /100 | #148 | Good 11.9% |
| Immigrants | Oceania | 77.7 /100 | #149 | Good 11.9% |
| Immigrants | Portugal | 77.3 /100 | #150 | Good 11.9% |