Chippewa vs Immigrants from Cambodia Single Mother Households
COMPARE
Chippewa
Immigrants from Cambodia
Single Mother Households
Single Mother Households Comparison
Chippewa
Immigrants from Cambodia
8.0%
SINGLE MOTHER HOUSEHOLDS
0.0/ 100
METRIC RATING
301st/ 347
METRIC RANK
7.2%
SINGLE MOTHER HOUSEHOLDS
0.5/ 100
METRIC RATING
245th/ 347
METRIC RANK
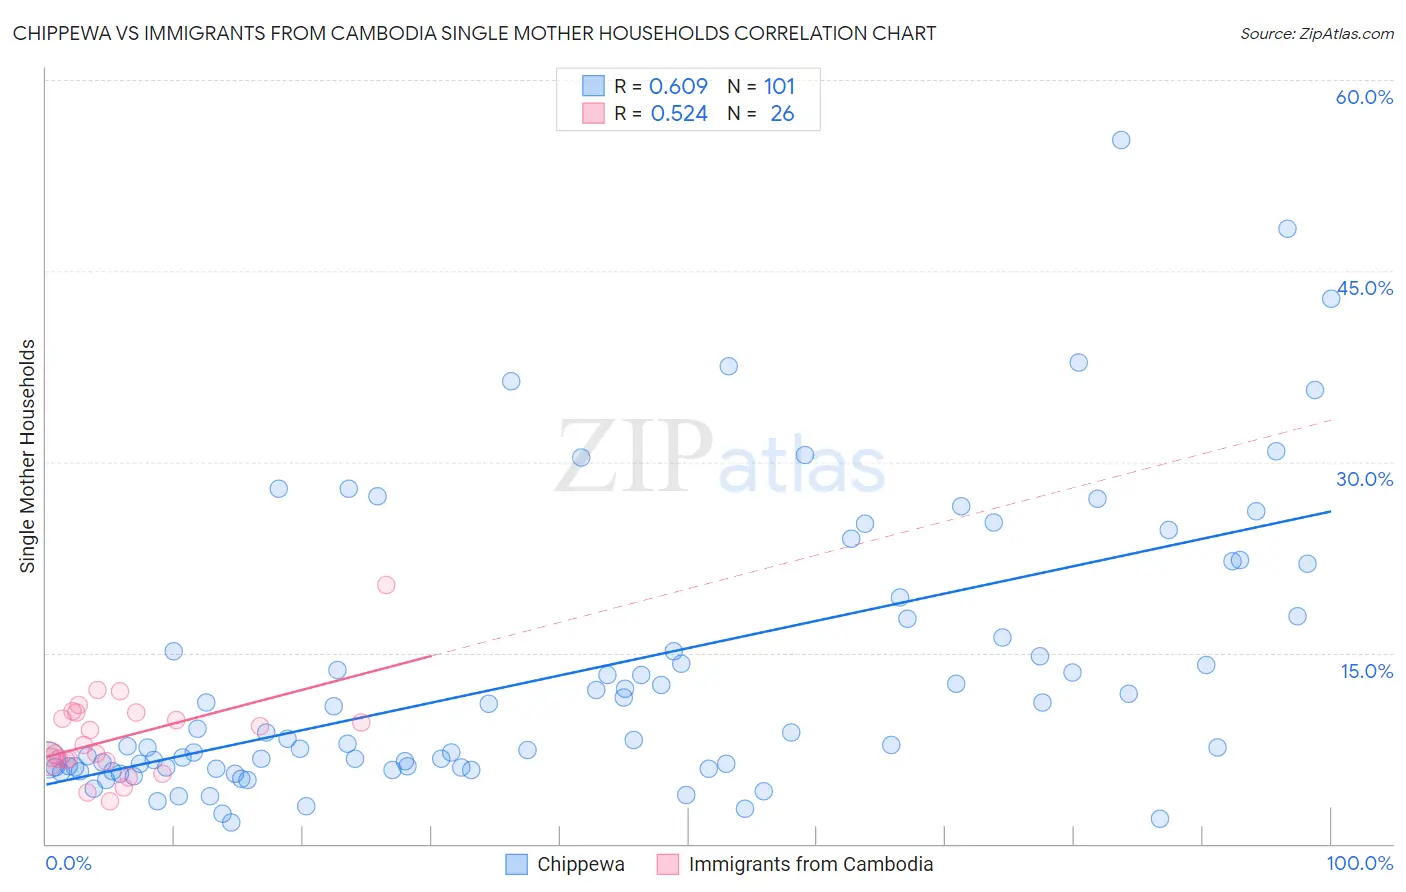
Chippewa vs Immigrants from Cambodia Single Mother Households Correlation Chart
The statistical analysis conducted on geographies consisting of 214,662,896 people shows a significant positive correlation between the proportion of Chippewa and percentage of single mother households in the United States with a correlation coefficient (R) of 0.609 and weighted average of 8.0%. Similarly, the statistical analysis conducted on geographies consisting of 205,083,735 people shows a substantial positive correlation between the proportion of Immigrants from Cambodia and percentage of single mother households in the United States with a correlation coefficient (R) of 0.524 and weighted average of 7.2%, a difference of 10.4%.
Single Mother Households Correlation Summary
| Measurement | Chippewa | Immigrants from Cambodia |
| Minimum | 1.7% | 3.3% |
| Maximum | 55.3% | 20.4% |
| Range | 53.6% | 17.1% |
| Mean | 13.4% | 8.4% |
| Median | 8.2% | 7.4% |
| Interquartile 25% (IQ1) | 6.0% | 6.6% |
| Interquartile 75% (IQ3) | 17.8% | 10.3% |
| Interquartile Range (IQR) | 11.8% | 3.7% |
| Standard Deviation (Sample) | 11.0% | 3.4% |
| Standard Deviation (Population) | 11.0% | 3.4% |
Similar Demographics by Single Mother Households
Demographics Similar to Chippewa by Single Mother Households
In terms of single mother households, the demographic groups most similar to Chippewa are Immigrants from Ghana (8.0%, a difference of 0.10%), Immigrants from Bahamas (8.0%, a difference of 0.12%), Mexican (8.0%, a difference of 0.16%), Native/Alaskan (8.0%, a difference of 0.56%), and Colville (8.0%, a difference of 0.61%).
| Demographics | Rating | Rank | Single Mother Households |
| Apache | 0.0 /100 | #294 | Tragic 7.9% |
| Barbadians | 0.0 /100 | #295 | Tragic 7.9% |
| Immigrants | Latin America | 0.0 /100 | #296 | Tragic 7.9% |
| Hispanics or Latinos | 0.0 /100 | #297 | Tragic 7.9% |
| Immigrants | West Indies | 0.0 /100 | #298 | Tragic 7.9% |
| Houma | 0.0 /100 | #299 | Tragic 7.9% |
| Mexicans | 0.0 /100 | #300 | Tragic 8.0% |
| Chippewa | 0.0 /100 | #301 | Tragic 8.0% |
| Immigrants | Ghana | 0.0 /100 | #302 | Tragic 8.0% |
| Immigrants | Bahamas | 0.0 /100 | #303 | Tragic 8.0% |
| Natives/Alaskans | 0.0 /100 | #304 | Tragic 8.0% |
| Colville | 0.0 /100 | #305 | Tragic 8.0% |
| Immigrants | Barbados | 0.0 /100 | #306 | Tragic 8.0% |
| Immigrants | St. Vincent and the Grenadines | 0.0 /100 | #307 | Tragic 8.0% |
| Immigrants | Central America | 0.0 /100 | #308 | Tragic 8.1% |
Demographics Similar to Immigrants from Cambodia by Single Mother Households
In terms of single mother households, the demographic groups most similar to Immigrants from Cambodia are Nicaraguan (7.2%, a difference of 0.18%), Cuban (7.2%, a difference of 0.34%), Ecuadorian (7.2%, a difference of 0.41%), Dutch West Indian (7.3%, a difference of 0.43%), and Fijian (7.2%, a difference of 0.46%).
| Demographics | Rating | Rank | Single Mother Households |
| Panamanians | 0.9 /100 | #238 | Tragic 7.1% |
| Kiowa | 0.8 /100 | #239 | Tragic 7.1% |
| Immigrants | Panama | 0.7 /100 | #240 | Tragic 7.2% |
| Immigrants | Portugal | 0.6 /100 | #241 | Tragic 7.2% |
| Fijians | 0.6 /100 | #242 | Tragic 7.2% |
| Ecuadorians | 0.6 /100 | #243 | Tragic 7.2% |
| Cubans | 0.6 /100 | #244 | Tragic 7.2% |
| Immigrants | Cambodia | 0.5 /100 | #245 | Tragic 7.2% |
| Nicaraguans | 0.5 /100 | #246 | Tragic 7.2% |
| Dutch West Indians | 0.4 /100 | #247 | Tragic 7.3% |
| Spanish American Indians | 0.4 /100 | #248 | Tragic 7.3% |
| Bermudans | 0.4 /100 | #249 | Tragic 7.3% |
| Immigrants | Africa | 0.4 /100 | #250 | Tragic 7.3% |
| Malaysians | 0.3 /100 | #251 | Tragic 7.3% |
| Alaskan Athabascans | 0.3 /100 | #252 | Tragic 7.3% |