Chilean vs Immigrants from Saudi Arabia Married-couple Households

COMPARE

Chilean
Race
Ancestry
AfghanAfricanAlaska NativeAlaskan AthabascanAlbanianAleutAlsatianAmericanApacheArabArapahoArgentineanArmenianAssyrian/Chaldean/SyriacAustralianAustrianBahamianBangladeshiBarbadianBasqueBelgianBelizeanBermudanBhutaneseBlackfeetBolivianBrazilianBritishBritish West IndianBulgarianBurmeseCajunCambodianCanadianCape VerdeanCarpatho RusynCelticCentral AmericanCentral American IndianCherokeeCheyenneChickasawChileanChineseChippewaChoctawColombianColvilleComancheCosta RicanCreeCreekCroatianCrowCubanCypriotCzechCzechoslovakianDanishDelawareDominicanDutchDutch West IndianEastern EuropeanEcuadorianEgyptianEnglishEstonianEthiopianEuropeanFijianFilipinoFinnishFrenchFrench American IndianFrench CanadianGermanGerman RussianGhanaianGreekGuamanian/ChamorroGuatemalanGuyaneseHaitianHmongHonduranHopiHoumaHungarianIcelanderIndian (Asian)IndonesianInupiatIranianIraqiIrishIroquoisIsraeliItalianJamaicanJapaneseJordanianKenyanKiowaKoreanLaotianLatvianLebaneseLiberianLithuanianLumbeeLuxembourgerMacedonianMalaysianMalteseMarshalleseMenomineeMexicanMexican American IndianMongolianMoroccanNative HawaiianNavajoNepaleseNew ZealanderNicaraguanNigerianNorthern EuropeanNorwegianOkinawanOsageOttawaPaiutePakistaniPalestinianPanamanianParaguayanPennsylvania GermanPeruvianPimaPolishPortuguesePotawatomiPuebloPuerto RicanPuget Sound SalishRomanianRussianSalvadoranSamoanScandinavianScotch-IrishScottishSeminoleSenegaleseSerbianShoshoneSierra LeoneanSiouxSlavicSlovakSloveneSomaliSouth AfricanSouth AmericanSouth American IndianSoviet UnionSpaniardSpanishSpanish AmericanSpanish American IndianSri LankanSubsaharan AfricanSudaneseSwedishSwissSyrianTaiwaneseThaiTlingit-HaidaTohono O'OdhamTonganTrinidadian and TobagonianTsimshianTurkishU.S. Virgin IslanderUgandanUkrainianUruguayanUteVenezuelanVietnameseWelshWest IndianYakamaYaquiYugoslavianYumanYup'ikZimbabwean
Immigration
NonimmigrantsImmigrantsAfghanistanAfricaAlbaniaArgentinaArmeniaAsiaAustraliaAustriaBahamasBangladeshBarbadosBelarusBelgiumBelizeBoliviaBosnia and HerzegovinaBrazilBulgariaBurma/MyanmarCabo VerdeCambodiaCameroonCanadaCaribbeanCentral AmericaChileChinaColombiaCongoCosta RicaCroatiaCubaCzechoslovakiaDenmarkDominicaDominican RepublicEastern AfricaEastern AsiaEastern EuropeEcuadorEgyptEl SalvadorEnglandEritreaEthiopiaEuropeFijiFranceGermanyGhanaGreeceGrenadaGuatemalaGuyanaHaitiHondurasHong KongHungaryIndiaIndonesiaIranIraqIrelandIsraelItalyJamaicaJapanJordanKazakhstanKenyaKoreaKuwaitLaosLatin AmericaLatviaLebanonLiberiaLithuaniaMalaysiaMexicoMicronesiaMiddle AfricaMoldovaMoroccoNepalNetherlandsNicaraguaNigeriaNorth AmericaNorth MacedoniaNorthern AfricaNorthern EuropeNorwayOceaniaPakistanPanamaPeruPhilippinesPolandPortugalRomaniaRussiaScotlandSenegalSerbiaSierra LeoneSingaporeSomaliaSouth AfricaSouth AmericaSouth Central AsiaSouth Eastern AsiaSouthern EuropeSpainSri LankaSt. Vincent and the GrenadinesSudanSwedenSwitzerlandSyriaTaiwanThailandTrinidad and TobagoTurkeyUgandaUkraineUruguayUzbekistanVenezuelaVietnamWest IndiesWestern AfricaWestern AsiaWestern EuropeYemenZaireZimbabweAzores
Immigrants from Saudi Arabia
Race
Ancestry
AfghanAfricanAlaska NativeAlaskan AthabascanAlbanianAleutAlsatianAmericanApacheArabArapahoArgentineanArmenianAssyrian/Chaldean/SyriacAustralianAustrianBahamianBangladeshiBarbadianBasqueBelgianBelizeanBermudanBhutaneseBlackfeetBolivianBrazilianBritishBritish West IndianBulgarianBurmeseCajunCambodianCanadianCape VerdeanCarpatho RusynCelticCentral AmericanCentral American IndianCherokeeCheyenneChickasawChineseChippewaChoctawColombianColvilleComancheCosta RicanCreeCreekCroatianCrowCubanCypriotCzechCzechoslovakianDanishDelawareDominicanDutchDutch West IndianEastern EuropeanEcuadorianEgyptianEnglishEstonianEthiopianEuropeanFijianFilipinoFinnishFrenchFrench American IndianFrench CanadianGermanGerman RussianGhanaianGreekGuamanian/ChamorroGuatemalanGuyaneseHaitianHmongHonduranHopiHoumaHungarianIcelanderIndian (Asian)IndonesianInupiatIranianIraqiIrishIroquoisIsraeliItalianJamaicanJapaneseJordanianKenyanKiowaKoreanLaotianLatvianLebaneseLiberianLithuanianLumbeeLuxembourgerMacedonianMalaysianMalteseMarshalleseMenomineeMexicanMexican American IndianMongolianMoroccanNative HawaiianNavajoNepaleseNew ZealanderNicaraguanNigerianNorthern EuropeanNorwegianOkinawanOsageOttawaPaiutePakistaniPalestinianPanamanianParaguayanPennsylvania GermanPeruvianPimaPolishPortuguesePotawatomiPuebloPuerto RicanPuget Sound SalishRomanianRussianSalvadoranSamoanScandinavianScotch-IrishScottishSeminoleSenegaleseSerbianShoshoneSierra LeoneanSiouxSlavicSlovakSloveneSomaliSouth AfricanSouth AmericanSouth American IndianSoviet UnionSpaniardSpanishSpanish AmericanSpanish American IndianSri LankanSubsaharan AfricanSudaneseSwedishSwissSyrianTaiwaneseThaiTlingit-HaidaTohono O'OdhamTonganTrinidadian and TobagonianTsimshianTurkishU.S. Virgin IslanderUgandanUkrainianUruguayanUteVenezuelanVietnameseWelshWest IndianYakamaYaquiYugoslavianYumanYup'ikZimbabwean
Immigration
NonimmigrantsImmigrantsAfghanistanAfricaAlbaniaArgentinaArmeniaAsiaAustraliaAustriaBahamasBangladeshBarbadosBelarusBelgiumBelizeBoliviaBosnia and HerzegovinaBrazilBulgariaBurma/MyanmarCabo VerdeCambodiaCameroonCanadaCaribbeanCentral AmericaChileChinaColombiaCongoCosta RicaCroatiaCubaCzechoslovakiaDenmarkDominicaDominican RepublicEastern AfricaEastern AsiaEastern EuropeEcuadorEgyptEl SalvadorEnglandEritreaEthiopiaEuropeFijiFranceGermanyGhanaGreeceGrenadaGuatemalaGuyanaHaitiHondurasHong KongHungaryIndiaIndonesiaIranIraqIrelandIsraelItalyJamaicaJapanJordanKazakhstanKenyaKoreaKuwaitLaosLatin AmericaLatviaLebanonLiberiaLithuaniaMalaysiaMexicoMicronesiaMiddle AfricaMoldovaMoroccoNepalNetherlandsNicaraguaNigeriaNorth AmericaNorth MacedoniaNorthern AfricaNorthern EuropeNorwayOceaniaPakistanPanamaPeruPhilippinesPolandPortugalRomaniaRussiaSaudi ArabiaScotlandSenegalSerbiaSierra LeoneSingaporeSomaliaSouth AfricaSouth AmericaSouth Central AsiaSouth Eastern AsiaSouthern EuropeSpainSri LankaSt. Vincent and the GrenadinesSudanSwedenSwitzerlandSyriaTaiwanThailandTrinidad and TobagoTurkeyUgandaUkraineUruguayUzbekistanVenezuelaVietnamWest IndiesWestern AfricaWestern AsiaWestern EuropeYemenZaireZimbabweAzores
Married-couple Households
Income
Poverty
Unemployment
Labor Participation
Family Structure
Vehicle Availability
Education Level
Disability

Married-couple Households Comparison

Chileans

Immigrants from Saudi Arabia

Exceptional
Tragic
47.5%
MARRIED-COUPLE HOUSEHOLDS
92.2/ 100
METRIC RATING
119th/ 347
METRIC RANK
44.4%
MARRIED-COUPLE HOUSEHOLDS
0.9/ 100
METRIC RATING
243rd/ 347
METRIC RANK

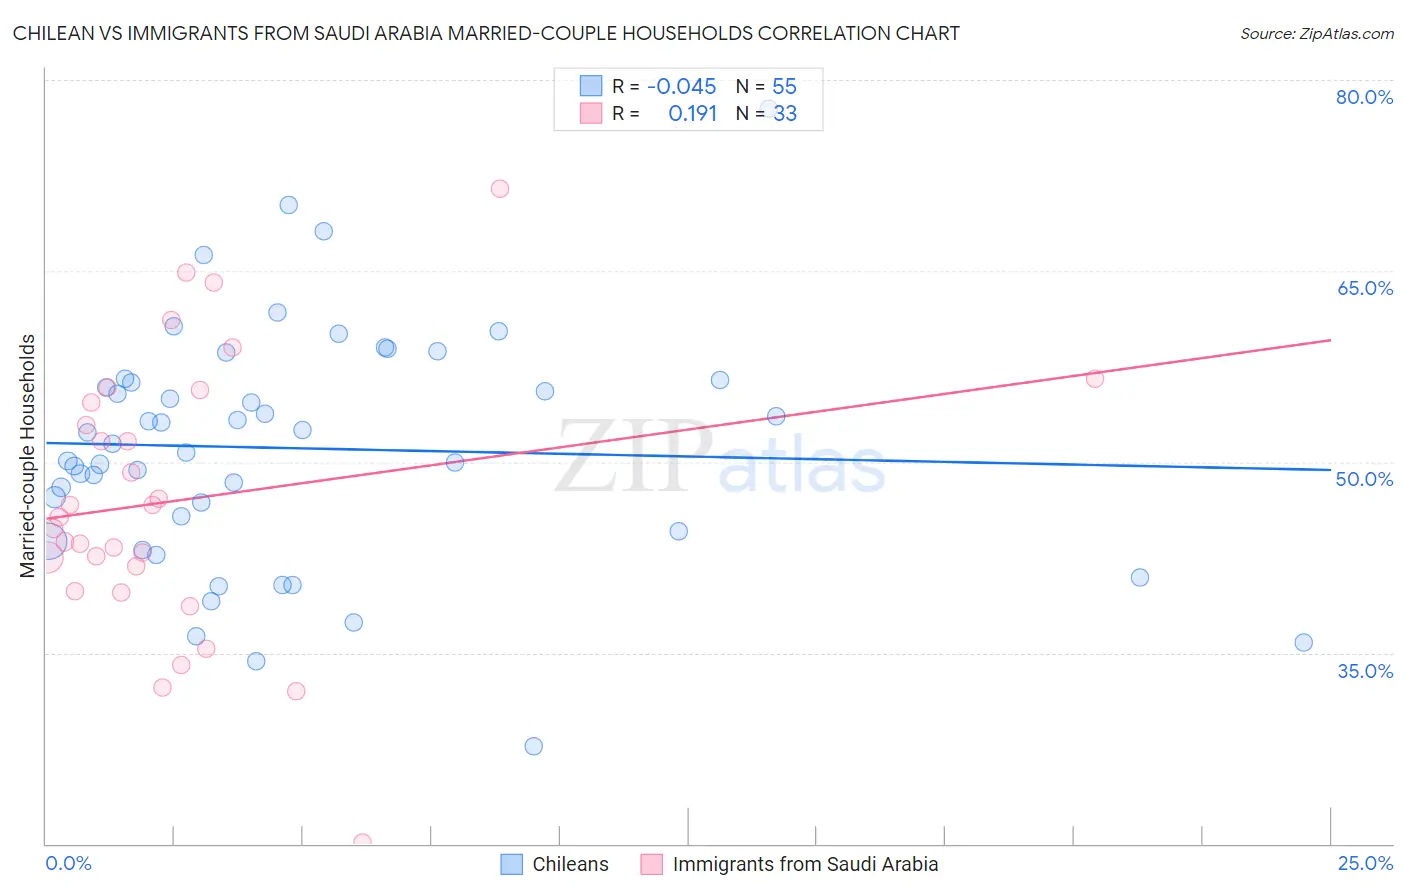
Chilean vs Immigrants from Saudi Arabia Married-couple Households Correlation Chart

The statistical analysis conducted on geographies consisting of 256,556,346 people shows no correlation between the proportion of Chileans and percentage of married-couple family households in the United States with a correlation coefficient (R) of -0.045 and weighted average of 47.5%. Similarly, the statistical analysis conducted on geographies consisting of 164,204,470 people shows a poor positive correlation between the proportion of Immigrants from Saudi Arabia and percentage of married-couple family households in the United States with a correlation coefficient (R) of 0.191 and weighted average of 44.4%, a difference of 7.0%.
Chilean vs Immigrants from Saudi Arabia Married-couple Households

Married-couple Households Correlation Summary

MeasurementChileanImmigrants from Saudi Arabia
Minimum27.7%20.1%
Maximum77.8%71.4%
Range50.1%51.4%
Mean51.1%47.0%
Median51.4%45.6%
Interquartile 25% (IQ1)44.6%40.8%
Interquartile 75% (IQ3)56.4%55.2%
Interquartile Range (IQR)11.8%14.3%
Standard Deviation (Sample)9.4%10.8%
Standard Deviation (Population)9.3%10.6%

Similar Demographics by Married-couple Households

Demographics Similar to Chileans by Married-couple Households

In terms of married-couple households, the demographic groups most similar to Chileans are French Canadian (47.5%, a difference of 0.030%), Immigrants from Germany (47.5%, a difference of 0.030%), Argentinean (47.5%, a difference of 0.050%), Slovak (47.6%, a difference of 0.10%), and Puget Sound Salish (47.4%, a difference of 0.19%).
DemographicsRating | RankMarried-couple Households
Peruvians
93.8
/100
|
#112
Exceptional
47.6%
Venezuelans
93.8
/100
|
#113
Exceptional
47.6%
Immigrants | Europe
93.7
/100
|
#114
Exceptional
47.6%
Slovaks
92.9
/100
|
#115
Exceptional
47.6%
Argentineans
92.5
/100
|
#116
Exceptional
47.5%
French Canadians
92.4
/100
|
#117
Exceptional
47.5%
Immigrants | Germany
92.4
/100
|
#118
Exceptional
47.5%
Chileans
92.2
/100
|
#119
Exceptional
47.5%
Puget Sound Salish
90.5
/100
|
#120
Exceptional
47.4%
Immigrants | Eastern Europe
90.3
/100
|
#121
Exceptional
47.4%
Okinawans
90.1
/100
|
#122
Exceptional
47.4%
Immigrants | Venezuela
89.3
/100
|
#123
Excellent
47.4%
Zimbabweans
89.2
/100
|
#124
Excellent
47.4%
Australians
89.0
/100
|
#125
Excellent
47.4%
Pakistanis
88.6
/100
|
#126
Excellent
47.3%

Demographics Similar to Immigrants from Saudi Arabia by Married-couple Households

In terms of married-couple households, the demographic groups most similar to Immigrants from Saudi Arabia are Immigrants from Albania (44.4%, a difference of 0.070%), Ute (44.4%, a difference of 0.11%), Immigrants from Bosnia and Herzegovina (44.4%, a difference of 0.11%), Spanish American (44.5%, a difference of 0.19%), and Immigrants from Uruguay (44.5%, a difference of 0.21%).
DemographicsRating | RankMarried-couple Households
Yaqui
1.2
/100
|
#236
Tragic
44.5%
Comanche
1.2
/100
|
#237
Tragic
44.5%
Immigrants | Uruguay
1.1
/100
|
#238
Tragic
44.5%
Spanish Americans
1.1
/100
|
#239
Tragic
44.5%
Ute
1.0
/100
|
#240
Tragic
44.4%
Immigrants | Bosnia and Herzegovina
1.0
/100
|
#241
Tragic
44.4%
Immigrants | Albania
1.0
/100
|
#242
Tragic
44.4%
Immigrants | Saudi Arabia
0.9
/100
|
#243
Tragic
44.4%
Immigrants | Armenia
0.7
/100
|
#244
Tragic
44.3%
Immigrants | El Salvador
0.7
/100
|
#245
Tragic
44.3%
Immigrants | Cuba
0.6
/100
|
#246
Tragic
44.2%
Immigrants | Morocco
0.6
/100
|
#247
Tragic
44.2%
Yup'ik
0.4
/100
|
#248
Tragic
44.1%
Immigrants | Kenya
0.4
/100
|
#249
Tragic
44.1%
French American Indians
0.4
/100
|
#250
Tragic
44.1%