Cheyenne vs Kiowa Single Father Households
COMPARE
Cheyenne
Kiowa
Single Father Households
Single Father Households Comparison
Cheyenne
Kiowa
2.9%
SINGLE FATHER HOUSEHOLDS
0.0/ 100
METRIC RATING
315th/ 347
METRIC RANK
2.8%
SINGLE FATHER HOUSEHOLDS
0.0/ 100
METRIC RATING
300th/ 347
METRIC RANK
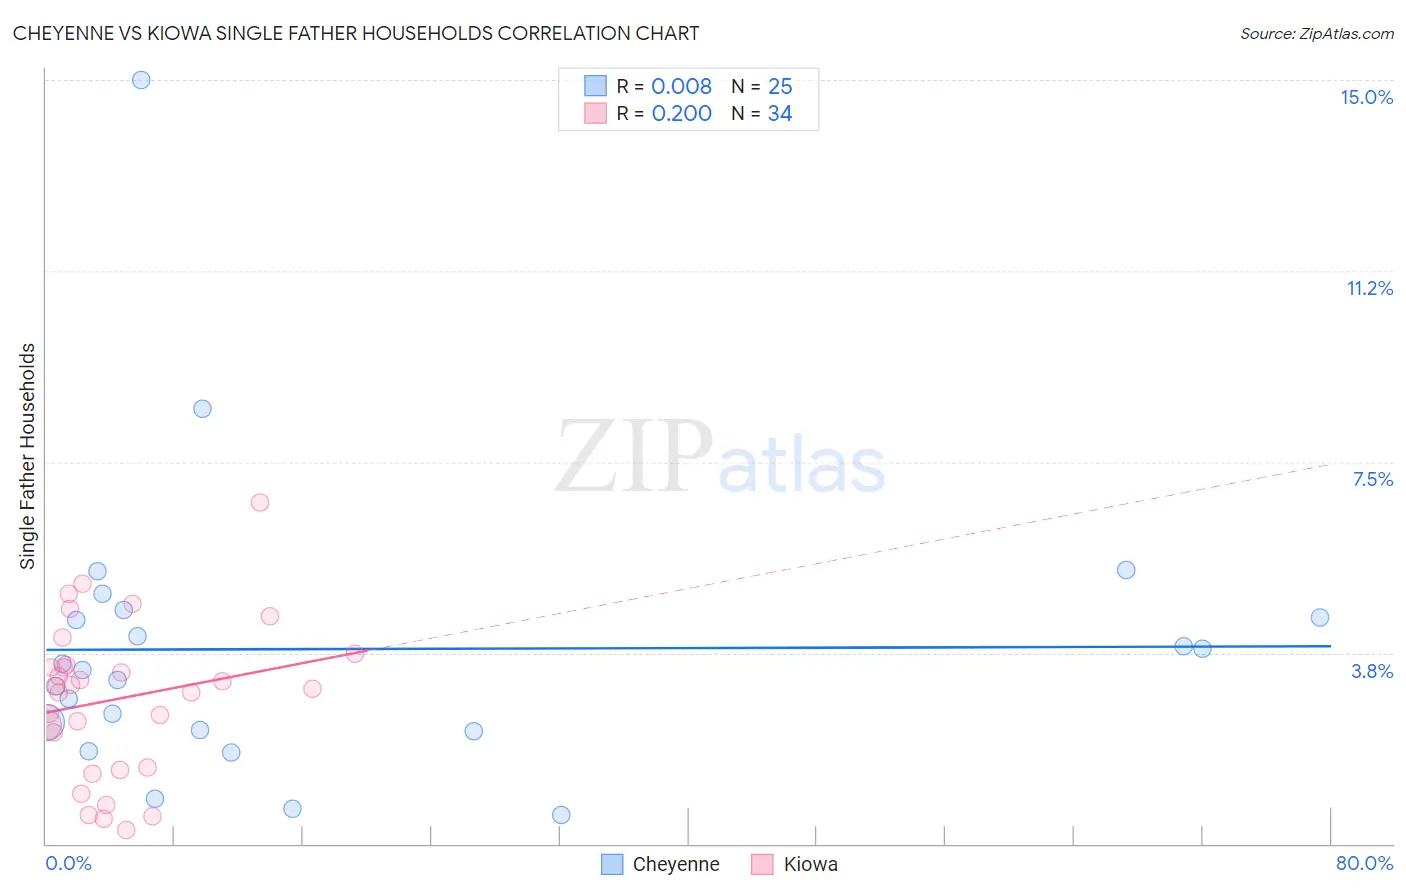
Cheyenne vs Kiowa Single Father Households Correlation Chart
The statistical analysis conducted on geographies consisting of 80,479,252 people shows no correlation between the proportion of Cheyenne and percentage of single father households in the United States with a correlation coefficient (R) of 0.008 and weighted average of 2.9%. Similarly, the statistical analysis conducted on geographies consisting of 56,039,243 people shows a weak positive correlation between the proportion of Kiowa and percentage of single father households in the United States with a correlation coefficient (R) of 0.200 and weighted average of 2.8%, a difference of 4.7%.
Single Father Households Correlation Summary
| Measurement | Cheyenne | Kiowa |
| Minimum | 0.55% | 0.27% |
| Maximum | 15.0% | 6.7% |
| Range | 14.4% | 6.4% |
| Mean | 3.8% | 2.9% |
| Median | 3.4% | 3.1% |
| Interquartile 25% (IQ1) | 2.2% | 1.5% |
| Interquartile 75% (IQ3) | 4.5% | 3.5% |
| Interquartile Range (IQR) | 2.3% | 2.0% |
| Standard Deviation (Sample) | 2.9% | 1.5% |
| Standard Deviation (Population) | 2.8% | 1.5% |
Demographics Similar to Cheyenne and Kiowa by Single Father Households
In terms of single father households, the demographic groups most similar to Cheyenne are Houma (2.9%, a difference of 0.0%), Salvadoran (2.9%, a difference of 0.39%), Arapaho (2.9%, a difference of 0.64%), Immigrants from El Salvador (2.9%, a difference of 0.86%), and Tsimshian (2.9%, a difference of 1.1%). Similarly, the demographic groups most similar to Kiowa are Immigrants from Latin America (2.8%, a difference of 0.050%), Lumbee (2.8%, a difference of 0.40%), Spanish American (2.8%, a difference of 0.58%), Immigrants from Honduras (2.8%, a difference of 0.60%), and Cree (2.8%, a difference of 0.77%).
| Demographics | Rating | Rank | Single Father Households |
| Hondurans | 0.0 /100 | #297 | Tragic 2.8% |
| Cree | 0.0 /100 | #298 | Tragic 2.8% |
| Lumbee | 0.0 /100 | #299 | Tragic 2.8% |
| Kiowa | 0.0 /100 | #300 | Tragic 2.8% |
| Immigrants | Latin America | 0.0 /100 | #301 | Tragic 2.8% |
| Spanish Americans | 0.0 /100 | #302 | Tragic 2.8% |
| Immigrants | Honduras | 0.0 /100 | #303 | Tragic 2.8% |
| Mexican American Indians | 0.0 /100 | #304 | Tragic 2.8% |
| Hispanics or Latinos | 0.0 /100 | #305 | Tragic 2.8% |
| Immigrants | Azores | 0.0 /100 | #306 | Tragic 2.8% |
| Hopi | 0.0 /100 | #307 | Tragic 2.8% |
| Apache | 0.0 /100 | #308 | Tragic 2.8% |
| Central Americans | 0.0 /100 | #309 | Tragic 2.9% |
| Immigrants | Laos | 0.0 /100 | #310 | Tragic 2.9% |
| Spanish American Indians | 0.0 /100 | #311 | Tragic 2.9% |
| Tsimshian | 0.0 /100 | #312 | Tragic 2.9% |
| Arapaho | 0.0 /100 | #313 | Tragic 2.9% |
| Salvadorans | 0.0 /100 | #314 | Tragic 2.9% |
| Cheyenne | 0.0 /100 | #315 | Tragic 2.9% |
| Houma | 0.0 /100 | #316 | Tragic 2.9% |
| Immigrants | El Salvador | 0.0 /100 | #317 | Tragic 2.9% |