Cheyenne vs Iroquois Married-couple Households
COMPARE
Cheyenne
Iroquois
Married-couple Households
Married-couple Households Comparison
Cheyenne
Iroquois
42.3%
MARRIED-COUPLE HOUSEHOLDS
0.0/ 100
METRIC RATING
284th/ 347
METRIC RANK
43.7%
MARRIED-COUPLE HOUSEHOLDS
0.2/ 100
METRIC RATING
259th/ 347
METRIC RANK
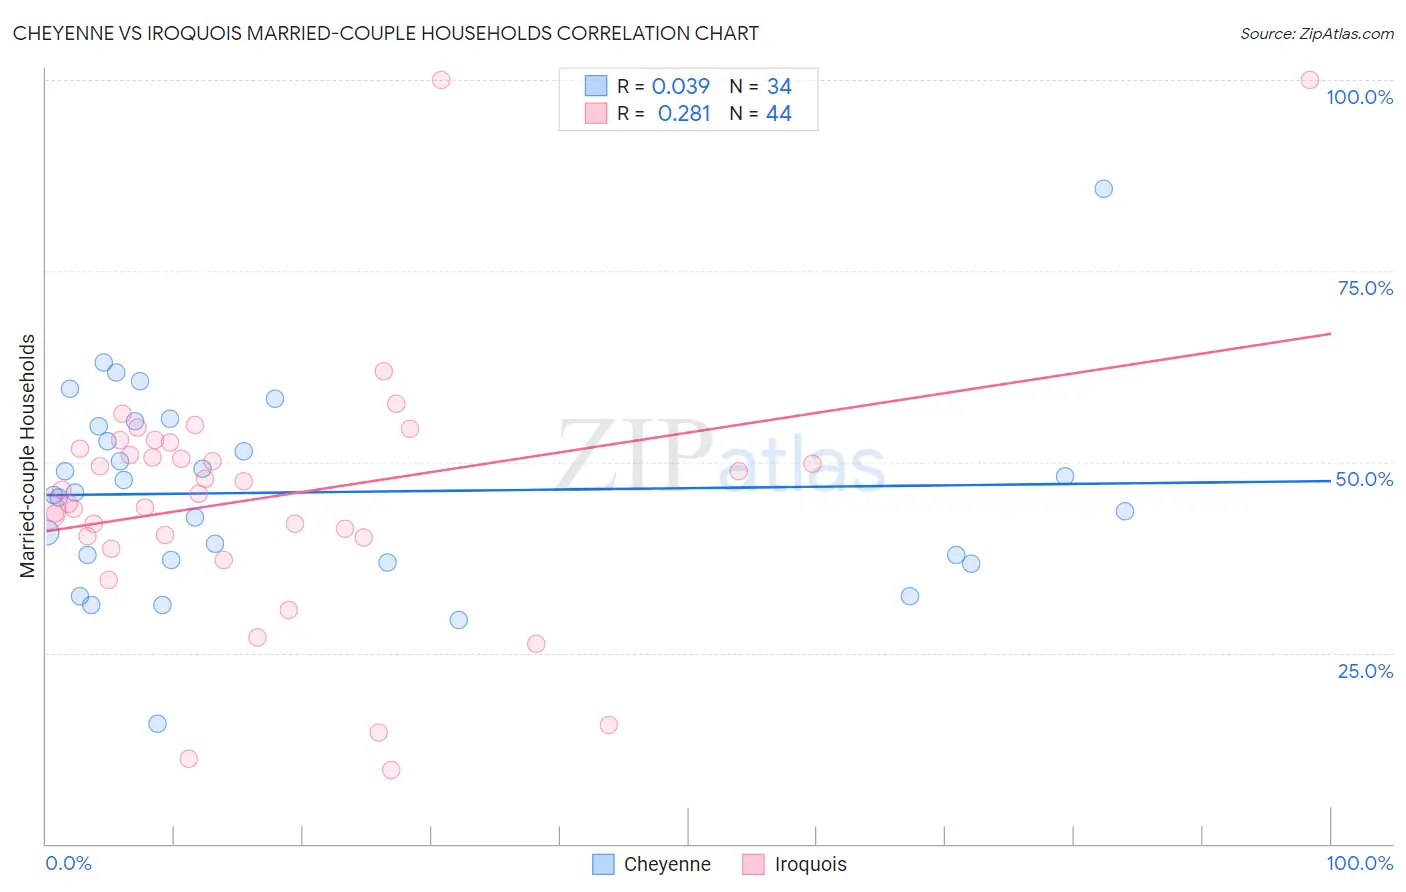
Cheyenne vs Iroquois Married-couple Households Correlation Chart
The statistical analysis conducted on geographies consisting of 80,704,994 people shows no correlation between the proportion of Cheyenne and percentage of married-couple family households in the United States with a correlation coefficient (R) of 0.039 and weighted average of 42.3%. Similarly, the statistical analysis conducted on geographies consisting of 207,249,804 people shows a weak positive correlation between the proportion of Iroquois and percentage of married-couple family households in the United States with a correlation coefficient (R) of 0.281 and weighted average of 43.7%, a difference of 3.5%.
Married-couple Households Correlation Summary
| Measurement | Cheyenne | Iroquois |
| Minimum | 15.8% | 9.6% |
| Maximum | 85.7% | 100.0% |
| Range | 69.9% | 90.4% |
| Mean | 46.0% | 45.4% |
| Median | 45.8% | 46.1% |
| Interquartile 25% (IQ1) | 37.1% | 40.2% |
| Interquartile 75% (IQ3) | 54.6% | 52.1% |
| Interquartile Range (IQR) | 17.5% | 12.0% |
| Standard Deviation (Sample) | 12.9% | 17.2% |
| Standard Deviation (Population) | 12.7% | 17.0% |
Similar Demographics by Married-couple Households
Demographics Similar to Cheyenne by Married-couple Households
In terms of married-couple households, the demographic groups most similar to Cheyenne are Ghanaian (42.2%, a difference of 0.030%), Belizean (42.2%, a difference of 0.040%), Chippewa (42.1%, a difference of 0.27%), Immigrants from Eritrea (42.1%, a difference of 0.35%), and Inupiat (42.4%, a difference of 0.36%).
| Demographics | Rating | Rank | Married-couple Households |
| Immigrants | Eastern Africa | 0.0 /100 | #277 | Tragic 42.9% |
| Immigrants | Africa | 0.0 /100 | #278 | Tragic 42.9% |
| Sierra Leoneans | 0.0 /100 | #279 | Tragic 42.9% |
| Immigrants | Ecuador | 0.0 /100 | #280 | Tragic 42.9% |
| Immigrants | Guatemala | 0.0 /100 | #281 | Tragic 42.8% |
| Bermudans | 0.0 /100 | #282 | Tragic 42.4% |
| Inupiat | 0.0 /100 | #283 | Tragic 42.4% |
| Cheyenne | 0.0 /100 | #284 | Tragic 42.3% |
| Ghanaians | 0.0 /100 | #285 | Tragic 42.2% |
| Belizeans | 0.0 /100 | #286 | Tragic 42.2% |
| Chippewa | 0.0 /100 | #287 | Tragic 42.1% |
| Immigrants | Eritrea | 0.0 /100 | #288 | Tragic 42.1% |
| Sudanese | 0.0 /100 | #289 | Tragic 42.1% |
| Hondurans | 0.0 /100 | #290 | Tragic 42.1% |
| Paiute | 0.0 /100 | #291 | Tragic 42.1% |
Demographics Similar to Iroquois by Married-couple Households
In terms of married-couple households, the demographic groups most similar to Iroquois are Central American Indian (43.8%, a difference of 0.030%), Blackfeet (43.8%, a difference of 0.070%), Immigrants from Cameroon (43.7%, a difference of 0.090%), Alaskan Athabascan (43.6%, a difference of 0.22%), and Ugandan (43.8%, a difference of 0.23%).
| Demographics | Rating | Rank | Married-couple Households |
| Seminole | 0.4 /100 | #252 | Tragic 44.0% |
| Central Americans | 0.3 /100 | #253 | Tragic 43.9% |
| Apache | 0.3 /100 | #254 | Tragic 43.9% |
| Shoshone | 0.3 /100 | #255 | Tragic 43.9% |
| Ugandans | 0.3 /100 | #256 | Tragic 43.8% |
| Blackfeet | 0.2 /100 | #257 | Tragic 43.8% |
| Central American Indians | 0.2 /100 | #258 | Tragic 43.8% |
| Iroquois | 0.2 /100 | #259 | Tragic 43.7% |
| Immigrants | Cameroon | 0.2 /100 | #260 | Tragic 43.7% |
| Alaskan Athabascans | 0.2 /100 | #261 | Tragic 43.6% |
| Vietnamese | 0.2 /100 | #262 | Tragic 43.6% |
| Cree | 0.1 /100 | #263 | Tragic 43.6% |
| Bangladeshis | 0.1 /100 | #264 | Tragic 43.5% |
| Moroccans | 0.1 /100 | #265 | Tragic 43.5% |
| Ecuadorians | 0.1 /100 | #266 | Tragic 43.5% |