Cheyenne vs Immigrants from Ethiopia Average Family Size
COMPARE
Cheyenne
Immigrants from Ethiopia
Average Family Size
Average Family Size Comparison
Cheyenne
Immigrants from Ethiopia
3.47
AVERAGE FAMILY SIZE
100.0/ 100
METRIC RATING
20th/ 347
METRIC RANK
3.25
AVERAGE FAMILY SIZE
81.6/ 100
METRIC RATING
139th/ 347
METRIC RANK
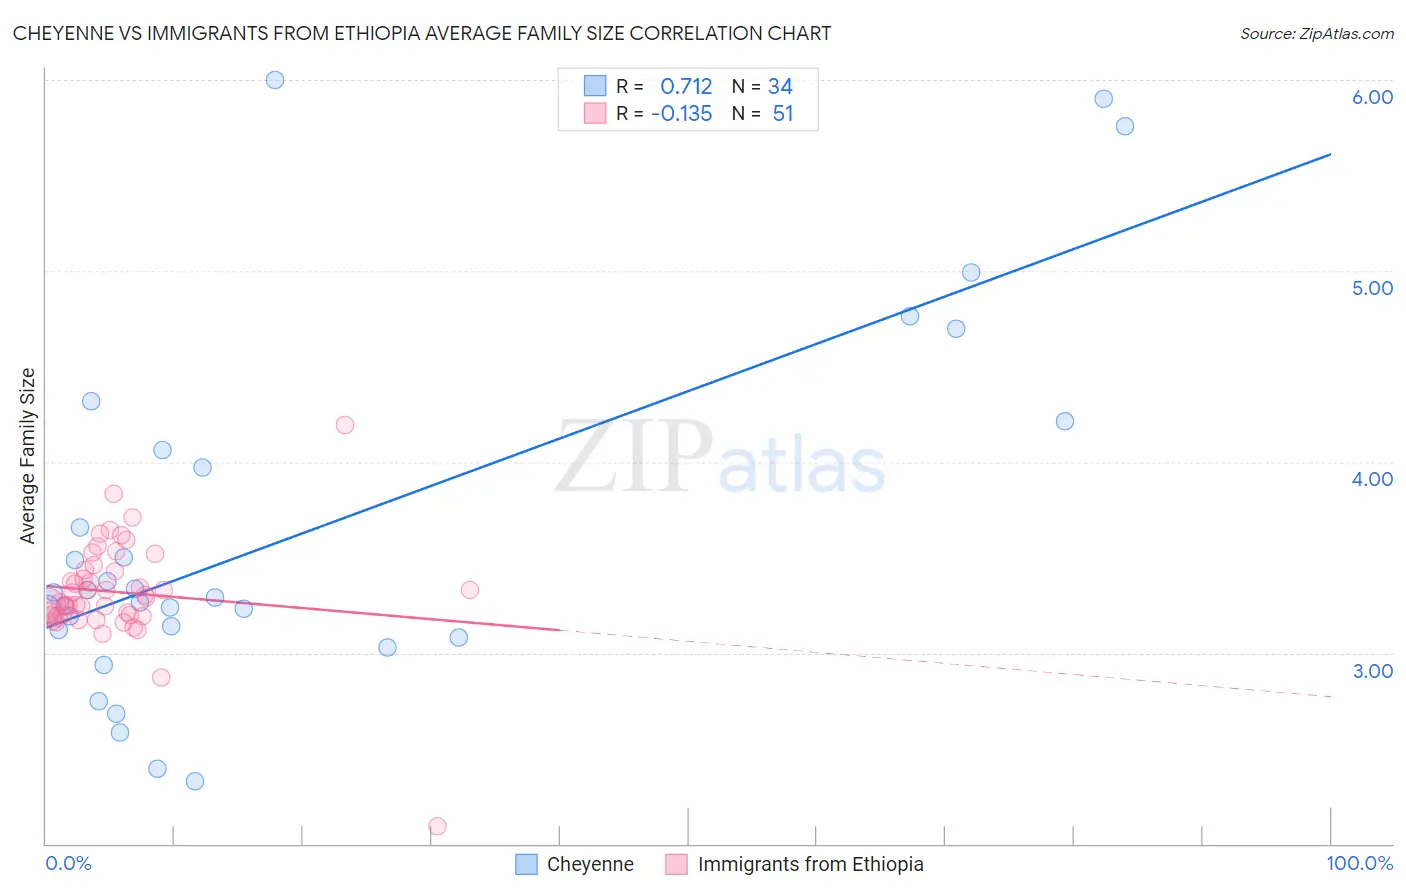
Cheyenne vs Immigrants from Ethiopia Average Family Size Correlation Chart
The statistical analysis conducted on geographies consisting of 80,705,196 people shows a strong positive correlation between the proportion of Cheyenne and average family size in the United States with a correlation coefficient (R) of 0.712 and weighted average of 3.47. Similarly, the statistical analysis conducted on geographies consisting of 211,454,545 people shows a poor negative correlation between the proportion of Immigrants from Ethiopia and average family size in the United States with a correlation coefficient (R) of -0.135 and weighted average of 3.25, a difference of 6.9%.
Average Family Size Correlation Summary
| Measurement | Cheyenne | Immigrants from Ethiopia |
| Minimum | 2.33 | 2.09 |
| Maximum | 6.00 | 4.19 |
| Range | 3.67 | 2.10 |
| Mean | 3.63 | 3.32 |
| Median | 3.30 | 3.29 |
| Interquartile 25% (IQ1) | 3.12 | 3.19 |
| Interquartile 75% (IQ3) | 4.06 | 3.43 |
| Interquartile Range (IQR) | 0.94 | 0.24 |
| Standard Deviation (Sample) | 0.95 | 0.28 |
| Standard Deviation (Population) | 0.94 | 0.28 |
Similar Demographics by Average Family Size
Demographics Similar to Cheyenne by Average Family Size
In terms of average family size, the demographic groups most similar to Cheyenne are Mexican (3.48, a difference of 0.040%), Salvadoran (3.48, a difference of 0.11%), Yuman (3.47, a difference of 0.25%), Apache (3.46, a difference of 0.31%), and Immigrants from El Salvador (3.49, a difference of 0.36%).
| Demographics | Rating | Rank | Average Family Size |
| Sioux | 100.0 /100 | #13 | Exceptional 3.52 |
| Immigrants | Central America | 100.0 /100 | #14 | Exceptional 3.49 |
| Tongans | 100.0 /100 | #15 | Exceptional 3.49 |
| Ute | 100.0 /100 | #16 | Exceptional 3.49 |
| Immigrants | El Salvador | 100.0 /100 | #17 | Exceptional 3.49 |
| Salvadorans | 100.0 /100 | #18 | Exceptional 3.48 |
| Mexicans | 100.0 /100 | #19 | Exceptional 3.48 |
| Cheyenne | 100.0 /100 | #20 | Exceptional 3.47 |
| Yuman | 100.0 /100 | #21 | Exceptional 3.47 |
| Apache | 100.0 /100 | #22 | Exceptional 3.46 |
| Immigrants | Fiji | 100.0 /100 | #23 | Exceptional 3.45 |
| Natives/Alaskans | 100.0 /100 | #24 | Exceptional 3.45 |
| Yakama | 100.0 /100 | #25 | Exceptional 3.45 |
| Native Hawaiians | 100.0 /100 | #26 | Exceptional 3.43 |
| Mexican American Indians | 100.0 /100 | #27 | Exceptional 3.43 |
Demographics Similar to Immigrants from Ethiopia by Average Family Size
In terms of average family size, the demographic groups most similar to Immigrants from Ethiopia are Subsaharan African (3.25, a difference of 0.0%), Cuban (3.25, a difference of 0.010%), Venezuelan (3.25, a difference of 0.010%), Liberian (3.25, a difference of 0.010%), and Immigrants from Middle Africa (3.25, a difference of 0.020%).
| Demographics | Rating | Rank | Average Family Size |
| Costa Ricans | 86.8 /100 | #132 | Excellent 3.26 |
| Immigrants | Venezuela | 86.3 /100 | #133 | Excellent 3.26 |
| Africans | 84.9 /100 | #134 | Excellent 3.25 |
| Panamanians | 84.2 /100 | #135 | Excellent 3.25 |
| Comanche | 82.8 /100 | #136 | Excellent 3.25 |
| Immigrants | Middle Africa | 82.4 /100 | #137 | Excellent 3.25 |
| Cubans | 81.8 /100 | #138 | Excellent 3.25 |
| Immigrants | Ethiopia | 81.6 /100 | #139 | Excellent 3.25 |
| Sub-Saharan Africans | 81.6 /100 | #140 | Excellent 3.25 |
| Venezuelans | 81.4 /100 | #141 | Excellent 3.25 |
| Liberians | 81.2 /100 | #142 | Excellent 3.25 |
| Bhutanese | 81.0 /100 | #143 | Excellent 3.25 |
| Tsimshian | 80.2 /100 | #144 | Excellent 3.25 |
| Armenians | 78.2 /100 | #145 | Good 3.25 |
| Immigrants | Africa | 77.9 /100 | #146 | Good 3.25 |