Cheyenne vs Czech Single Mother Households
COMPARE
Cheyenne
Czech
Single Mother Households
Single Mother Households Comparison
Cheyenne
Czechs
8.1%
SINGLE MOTHER HOUSEHOLDS
0.0/ 100
METRIC RATING
309th/ 347
METRIC RANK
5.6%
SINGLE MOTHER HOUSEHOLDS
97.9/ 100
METRIC RATING
80th/ 347
METRIC RANK
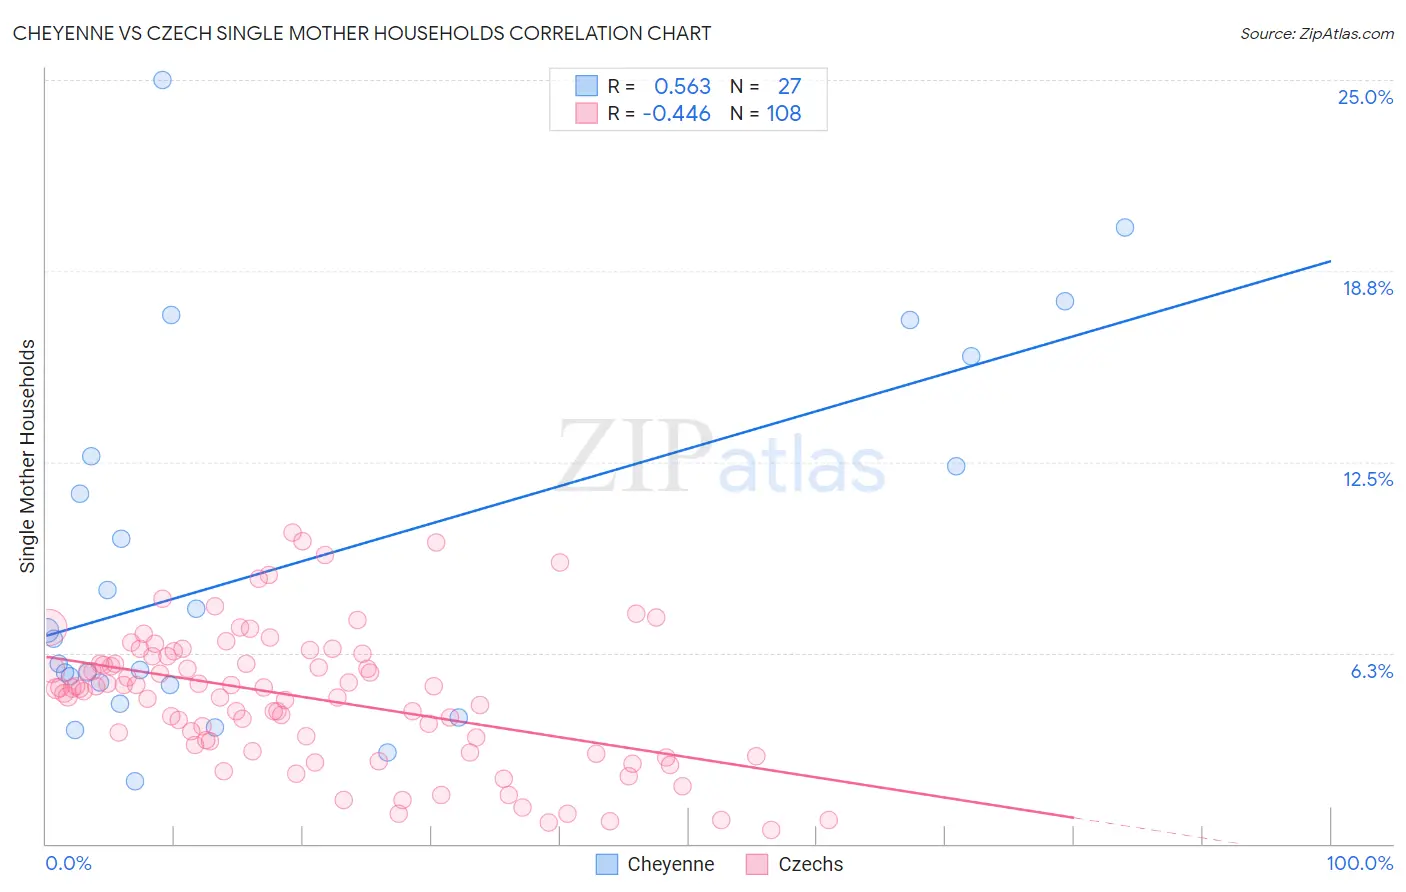
Cheyenne vs Czech Single Mother Households Correlation Chart
The statistical analysis conducted on geographies consisting of 80,615,278 people shows a substantial positive correlation between the proportion of Cheyenne and percentage of single mother households in the United States with a correlation coefficient (R) of 0.563 and weighted average of 8.1%. Similarly, the statistical analysis conducted on geographies consisting of 482,317,473 people shows a moderate negative correlation between the proportion of Czechs and percentage of single mother households in the United States with a correlation coefficient (R) of -0.446 and weighted average of 5.6%, a difference of 43.2%.
Single Mother Households Correlation Summary
| Measurement | Cheyenne | Czech |
| Minimum | 2.1% | 0.43% |
| Maximum | 25.0% | 10.2% |
| Range | 22.9% | 9.8% |
| Mean | 9.2% | 4.8% |
| Median | 6.7% | 5.1% |
| Interquartile 25% (IQ1) | 5.2% | 3.3% |
| Interquartile 75% (IQ3) | 12.7% | 6.1% |
| Interquartile Range (IQR) | 7.5% | 2.8% |
| Standard Deviation (Sample) | 6.0% | 2.2% |
| Standard Deviation (Population) | 5.9% | 2.2% |
Similar Demographics by Single Mother Households
Demographics Similar to Cheyenne by Single Mother Households
In terms of single mother households, the demographic groups most similar to Cheyenne are Honduran (8.1%, a difference of 0.050%), Immigrants from Congo (8.1%, a difference of 0.35%), Immigrants from Central America (8.1%, a difference of 0.44%), Immigrants from St. Vincent and the Grenadines (8.0%, a difference of 0.46%), and Bangladeshi (8.1%, a difference of 0.64%).
| Demographics | Rating | Rank | Single Mother Households |
| Immigrants | Ghana | 0.0 /100 | #302 | Tragic 8.0% |
| Immigrants | Bahamas | 0.0 /100 | #303 | Tragic 8.0% |
| Natives/Alaskans | 0.0 /100 | #304 | Tragic 8.0% |
| Colville | 0.0 /100 | #305 | Tragic 8.0% |
| Immigrants | Barbados | 0.0 /100 | #306 | Tragic 8.0% |
| Immigrants | St. Vincent and the Grenadines | 0.0 /100 | #307 | Tragic 8.0% |
| Immigrants | Central America | 0.0 /100 | #308 | Tragic 8.1% |
| Cheyenne | 0.0 /100 | #309 | Tragic 8.1% |
| Hondurans | 0.0 /100 | #310 | Tragic 8.1% |
| Immigrants | Congo | 0.0 /100 | #311 | Tragic 8.1% |
| Bangladeshis | 0.0 /100 | #312 | Tragic 8.1% |
| Immigrants | Grenada | 0.0 /100 | #313 | Tragic 8.2% |
| Immigrants | Mexico | 0.0 /100 | #314 | Tragic 8.2% |
| Immigrants | Western Africa | 0.0 /100 | #315 | Tragic 8.2% |
| Africans | 0.0 /100 | #316 | Tragic 8.2% |
Demographics Similar to Czechs by Single Mother Households
In terms of single mother households, the demographic groups most similar to Czechs are Immigrants from Moldova (5.6%, a difference of 0.0%), Immigrants from Sri Lanka (5.6%, a difference of 0.11%), Immigrants from Malaysia (5.7%, a difference of 0.22%), Immigrants from Hungary (5.7%, a difference of 0.24%), and Romanian (5.6%, a difference of 0.31%).
| Demographics | Rating | Rank | Single Mother Households |
| Immigrants | Asia | 98.4 /100 | #73 | Exceptional 5.6% |
| Immigrants | North America | 98.3 /100 | #74 | Exceptional 5.6% |
| Slovenes | 98.3 /100 | #75 | Exceptional 5.6% |
| New Zealanders | 98.2 /100 | #76 | Exceptional 5.6% |
| Romanians | 98.1 /100 | #77 | Exceptional 5.6% |
| Swiss | 98.1 /100 | #78 | Exceptional 5.6% |
| Immigrants | Sri Lanka | 98.0 /100 | #79 | Exceptional 5.6% |
| Czechs | 97.9 /100 | #80 | Exceptional 5.6% |
| Immigrants | Moldova | 97.9 /100 | #81 | Exceptional 5.6% |
| Immigrants | Malaysia | 97.8 /100 | #82 | Exceptional 5.7% |
| Immigrants | Hungary | 97.8 /100 | #83 | Exceptional 5.7% |
| Carpatho Rusyns | 97.7 /100 | #84 | Exceptional 5.7% |
| Hungarians | 97.6 /100 | #85 | Exceptional 5.7% |
| Finns | 97.6 /100 | #86 | Exceptional 5.7% |
| Immigrants | Turkey | 97.5 /100 | #87 | Exceptional 5.7% |