Carpatho Rusyn vs Immigrants from India Single Mother Households
COMPARE
Carpatho Rusyn
Immigrants from India
Single Mother Households
Single Mother Households Comparison
Carpatho Rusyns
Immigrants from India
5.7%
SINGLE MOTHER HOUSEHOLDS
97.7/ 100
METRIC RATING
84th/ 347
METRIC RANK
5.1%
SINGLE MOTHER HOUSEHOLDS
99.9/ 100
METRIC RATING
13th/ 347
METRIC RANK
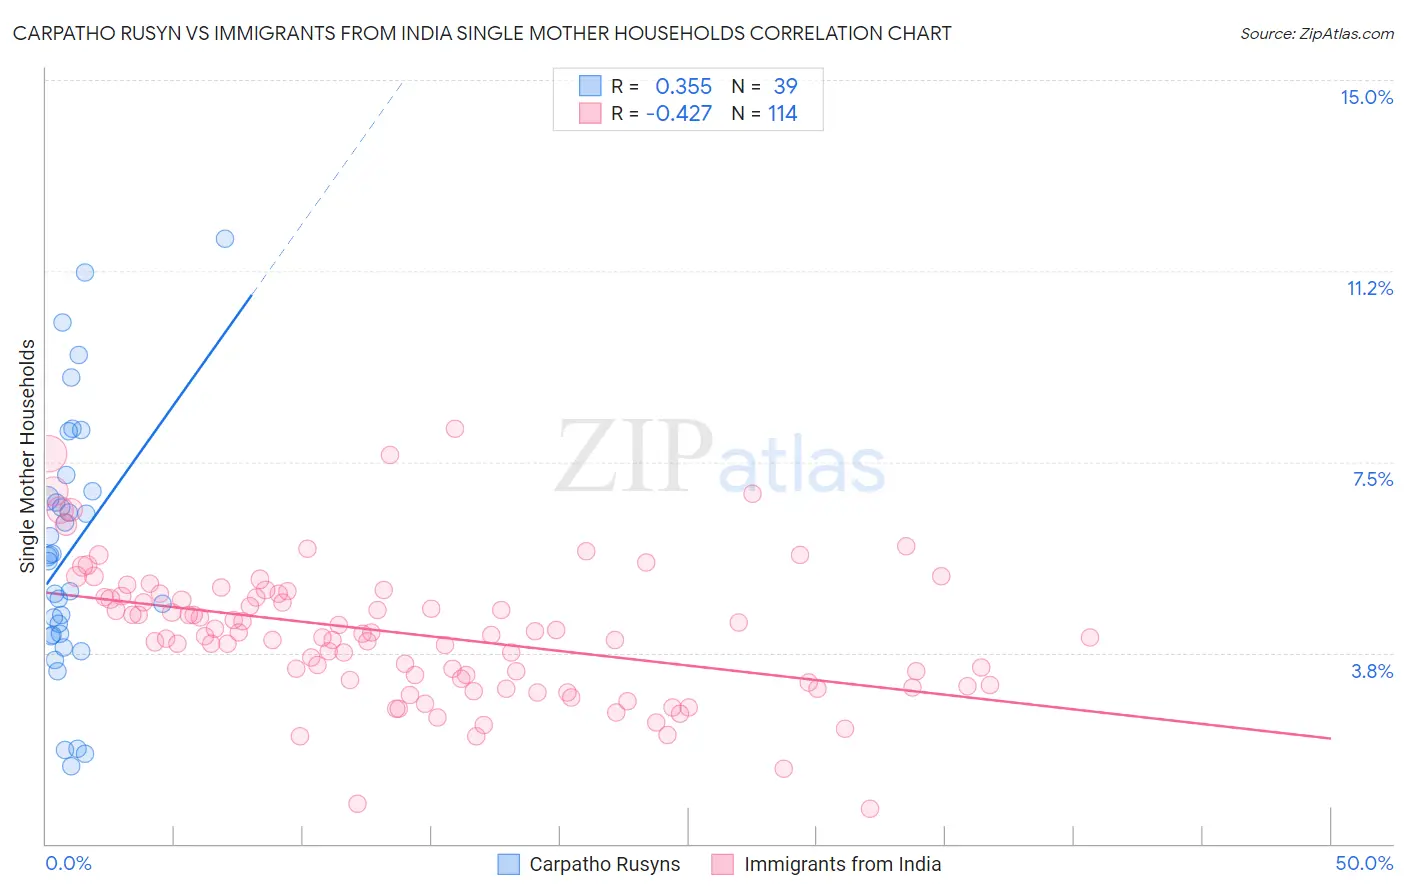
Carpatho Rusyn vs Immigrants from India Single Mother Households Correlation Chart
The statistical analysis conducted on geographies consisting of 58,858,752 people shows a mild positive correlation between the proportion of Carpatho Rusyns and percentage of single mother households in the United States with a correlation coefficient (R) of 0.355 and weighted average of 5.7%. Similarly, the statistical analysis conducted on geographies consisting of 432,741,319 people shows a moderate negative correlation between the proportion of Immigrants from India and percentage of single mother households in the United States with a correlation coefficient (R) of -0.427 and weighted average of 5.1%, a difference of 11.6%.
Single Mother Households Correlation Summary
| Measurement | Carpatho Rusyn | Immigrants from India |
| Minimum | 1.5% | 0.68% |
| Maximum | 11.9% | 8.1% |
| Range | 10.4% | 7.5% |
| Mean | 5.8% | 4.1% |
| Median | 5.6% | 4.1% |
| Interquartile 25% (IQ1) | 4.1% | 3.2% |
| Interquartile 75% (IQ3) | 6.9% | 4.9% |
| Interquartile Range (IQR) | 2.8% | 1.7% |
| Standard Deviation (Sample) | 2.5% | 1.3% |
| Standard Deviation (Population) | 2.5% | 1.3% |
Similar Demographics by Single Mother Households
Demographics Similar to Carpatho Rusyns by Single Mother Households
In terms of single mother households, the demographic groups most similar to Carpatho Rusyns are Immigrants from Hungary (5.7%, a difference of 0.080%), Immigrants from Malaysia (5.7%, a difference of 0.10%), Hungarian (5.7%, a difference of 0.15%), Finnish (5.7%, a difference of 0.18%), and Immigrants from Turkey (5.7%, a difference of 0.26%).
| Demographics | Rating | Rank | Single Mother Households |
| Romanians | 98.1 /100 | #77 | Exceptional 5.6% |
| Swiss | 98.1 /100 | #78 | Exceptional 5.6% |
| Immigrants | Sri Lanka | 98.0 /100 | #79 | Exceptional 5.6% |
| Czechs | 97.9 /100 | #80 | Exceptional 5.6% |
| Immigrants | Moldova | 97.9 /100 | #81 | Exceptional 5.6% |
| Immigrants | Malaysia | 97.8 /100 | #82 | Exceptional 5.7% |
| Immigrants | Hungary | 97.8 /100 | #83 | Exceptional 5.7% |
| Carpatho Rusyns | 97.7 /100 | #84 | Exceptional 5.7% |
| Hungarians | 97.6 /100 | #85 | Exceptional 5.7% |
| Finns | 97.6 /100 | #86 | Exceptional 5.7% |
| Immigrants | Turkey | 97.5 /100 | #87 | Exceptional 5.7% |
| Israelis | 97.4 /100 | #88 | Exceptional 5.7% |
| Ukrainians | 97.2 /100 | #89 | Exceptional 5.7% |
| Immigrants | Indonesia | 97.2 /100 | #90 | Exceptional 5.7% |
| Europeans | 97.0 /100 | #91 | Exceptional 5.7% |
Demographics Similar to Immigrants from India by Single Mother Households
In terms of single mother households, the demographic groups most similar to Immigrants from India are Cypriot (5.1%, a difference of 0.12%), Immigrants from China (5.1%, a difference of 0.30%), Immigrants from Australia (5.1%, a difference of 0.32%), Immigrants from Eastern Asia (5.1%, a difference of 0.42%), and Indian (Asian) (5.1%, a difference of 0.60%).
| Demographics | Rating | Rank | Single Mother Households |
| Immigrants | Singapore | 100.0 /100 | #6 | Exceptional 5.0% |
| Iranians | 100.0 /100 | #7 | Exceptional 5.0% |
| Immigrants | Ireland | 99.9 /100 | #8 | Exceptional 5.0% |
| Okinawans | 99.9 /100 | #9 | Exceptional 5.0% |
| Immigrants | Israel | 99.9 /100 | #10 | Exceptional 5.0% |
| Immigrants | China | 99.9 /100 | #11 | Exceptional 5.1% |
| Cypriots | 99.9 /100 | #12 | Exceptional 5.1% |
| Immigrants | India | 99.9 /100 | #13 | Exceptional 5.1% |
| Immigrants | Australia | 99.9 /100 | #14 | Exceptional 5.1% |
| Immigrants | Eastern Asia | 99.9 /100 | #15 | Exceptional 5.1% |
| Indians (Asian) | 99.9 /100 | #16 | Exceptional 5.1% |
| Soviet Union | 99.9 /100 | #17 | Exceptional 5.1% |
| Immigrants | Armenia | 99.9 /100 | #18 | Exceptional 5.2% |
| Chinese | 99.9 /100 | #19 | Exceptional 5.2% |
| Maltese | 99.9 /100 | #20 | Exceptional 5.2% |