Cape Verdean vs Burmese Divorced or Separated
COMPARE
Cape Verdean
Burmese
Divorced or Separated
Divorced or Separated Comparison
Cape Verdeans
Burmese
13.1%
DIVORCED OR SEPARATED
0.0/ 100
METRIC RATING
303rd/ 347
METRIC RANK
10.7%
DIVORCED OR SEPARATED
100.0/ 100
METRIC RATING
20th/ 347
METRIC RANK
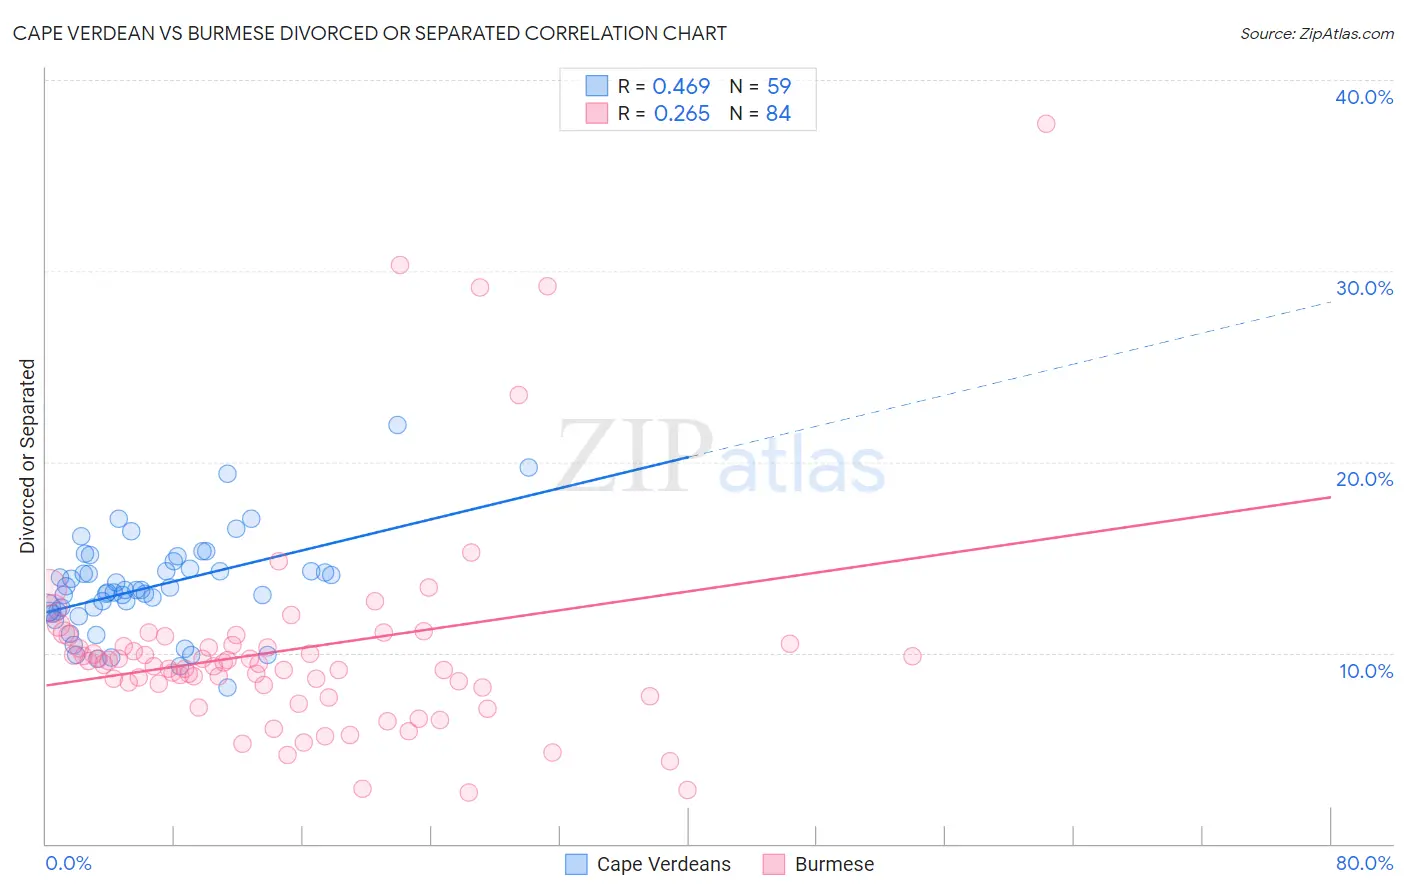
Cape Verdean vs Burmese Divorced or Separated Correlation Chart
The statistical analysis conducted on geographies consisting of 107,557,736 people shows a moderate positive correlation between the proportion of Cape Verdeans and percentage of population currently divorced or separated in the United States with a correlation coefficient (R) of 0.469 and weighted average of 13.1%. Similarly, the statistical analysis conducted on geographies consisting of 465,063,245 people shows a weak positive correlation between the proportion of Burmese and percentage of population currently divorced or separated in the United States with a correlation coefficient (R) of 0.265 and weighted average of 10.7%, a difference of 22.6%.
Divorced or Separated Correlation Summary
| Measurement | Cape Verdean | Burmese |
| Minimum | 8.2% | 2.7% |
| Maximum | 21.9% | 37.7% |
| Range | 13.7% | 35.0% |
| Mean | 13.4% | 10.2% |
| Median | 13.3% | 9.4% |
| Interquartile 25% (IQ1) | 12.2% | 8.3% |
| Interquartile 75% (IQ3) | 14.4% | 10.4% |
| Interquartile Range (IQR) | 2.2% | 2.2% |
| Standard Deviation (Sample) | 2.6% | 5.7% |
| Standard Deviation (Population) | 2.5% | 5.6% |
Similar Demographics by Divorced or Separated
Demographics Similar to Cape Verdeans by Divorced or Separated
In terms of divorced or separated, the demographic groups most similar to Cape Verdeans are Immigrants from Venezuela (13.1%, a difference of 0.020%), Alaskan Athabascan (13.1%, a difference of 0.12%), Hopi (13.2%, a difference of 0.13%), Chippewa (13.2%, a difference of 0.18%), and Immigrants from Cabo Verde (13.1%, a difference of 0.33%).
| Demographics | Rating | Rank | Divorced or Separated |
| Nicaraguans | 0.0 /100 | #296 | Tragic 13.0% |
| Natives/Alaskans | 0.0 /100 | #297 | Tragic 13.0% |
| Venezuelans | 0.0 /100 | #298 | Tragic 13.0% |
| Immigrants | Jamaica | 0.0 /100 | #299 | Tragic 13.0% |
| Immigrants | Cabo Verde | 0.0 /100 | #300 | Tragic 13.1% |
| Alaskan Athabascans | 0.0 /100 | #301 | Tragic 13.1% |
| Immigrants | Venezuela | 0.0 /100 | #302 | Tragic 13.1% |
| Cape Verdeans | 0.0 /100 | #303 | Tragic 13.1% |
| Hopi | 0.0 /100 | #304 | Tragic 13.2% |
| Chippewa | 0.0 /100 | #305 | Tragic 13.2% |
| Tlingit-Haida | 0.0 /100 | #306 | Tragic 13.2% |
| French American Indians | 0.0 /100 | #307 | Tragic 13.2% |
| Ottawa | 0.0 /100 | #308 | Tragic 13.2% |
| Americans | 0.0 /100 | #309 | Tragic 13.2% |
| Africans | 0.0 /100 | #310 | Tragic 13.2% |
Demographics Similar to Burmese by Divorced or Separated
In terms of divorced or separated, the demographic groups most similar to Burmese are Immigrants from Asia (10.7%, a difference of 0.18%), Vietnamese (10.8%, a difference of 0.44%), Immigrants from Pakistan (10.8%, a difference of 0.62%), Immigrants from Iran (10.6%, a difference of 0.74%), and Asian (10.6%, a difference of 0.74%).
| Demographics | Rating | Rank | Divorced or Separated |
| Cypriots | 100.0 /100 | #13 | Exceptional 10.5% |
| Assyrians/Chaldeans/Syriacs | 100.0 /100 | #14 | Exceptional 10.6% |
| Immigrants | Armenia | 100.0 /100 | #15 | Exceptional 10.6% |
| Immigrants | Korea | 100.0 /100 | #16 | Exceptional 10.6% |
| Immigrants | Israel | 100.0 /100 | #17 | Exceptional 10.6% |
| Immigrants | Iran | 100.0 /100 | #18 | Exceptional 10.6% |
| Asians | 100.0 /100 | #19 | Exceptional 10.6% |
| Burmese | 100.0 /100 | #20 | Exceptional 10.7% |
| Immigrants | Asia | 100.0 /100 | #21 | Exceptional 10.7% |
| Vietnamese | 100.0 /100 | #22 | Exceptional 10.8% |
| Immigrants | Pakistan | 100.0 /100 | #23 | Exceptional 10.8% |
| Immigrants | Sri Lanka | 100.0 /100 | #24 | Exceptional 10.8% |
| Iranians | 100.0 /100 | #25 | Exceptional 10.8% |
| Immigrants | Indonesia | 100.0 /100 | #26 | Exceptional 10.9% |
| Immigrants | Bangladesh | 100.0 /100 | #27 | Exceptional 11.0% |