Cape Verdean vs Afghan Married-couple Households
COMPARE
Cape Verdean
Afghan
Married-couple Households
Married-couple Households Comparison
Cape Verdeans
Afghans
38.1%
MARRIED-COUPLE HOUSEHOLDS
0.0/ 100
METRIC RATING
341st/ 347
METRIC RANK
48.0%
MARRIED-COUPLE HOUSEHOLDS
97.3/ 100
METRIC RATING
88th/ 347
METRIC RANK
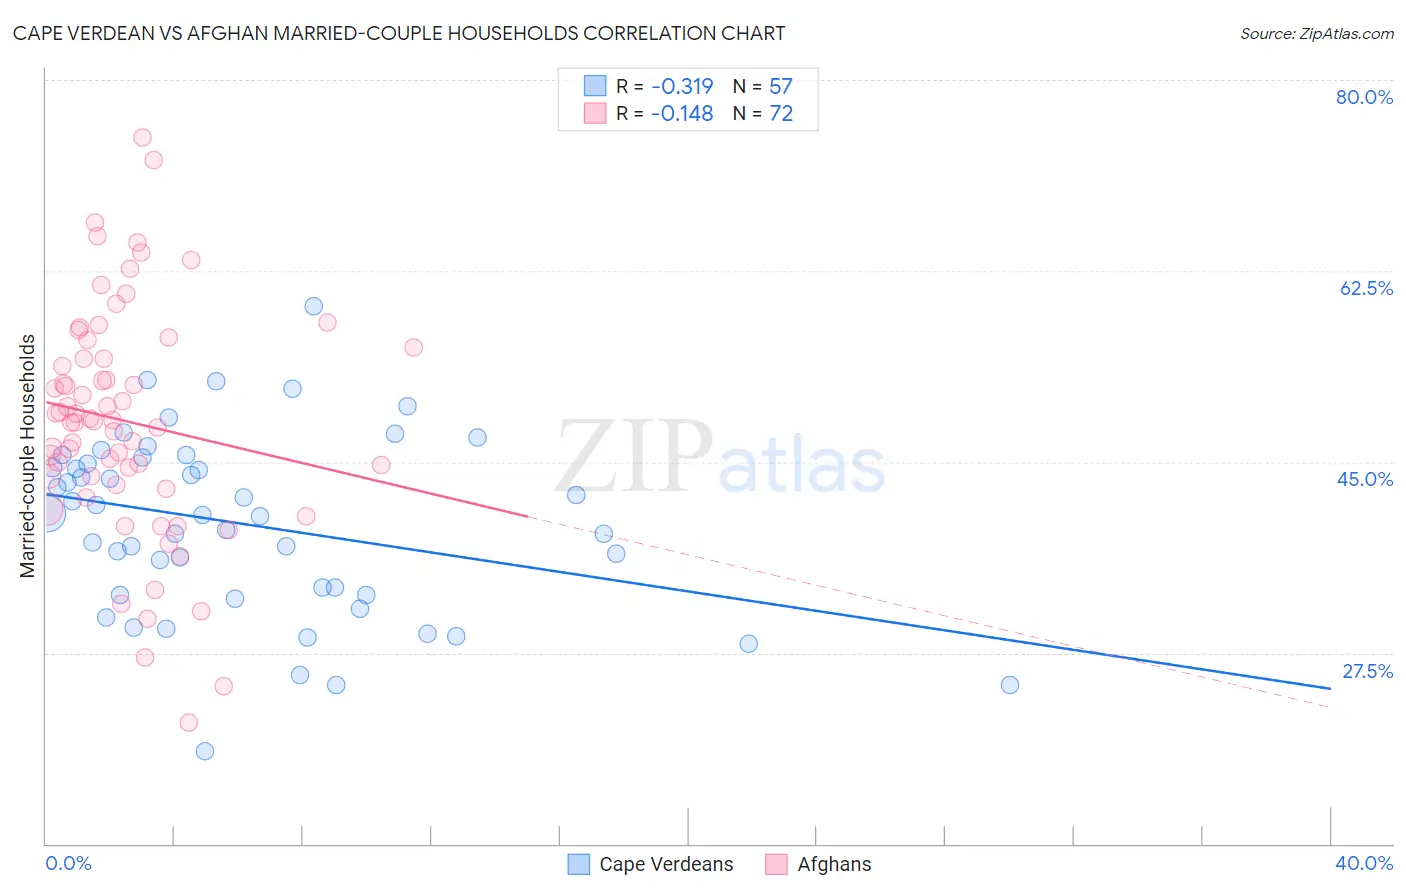
Cape Verdean vs Afghan Married-couple Households Correlation Chart
The statistical analysis conducted on geographies consisting of 107,548,823 people shows a mild negative correlation between the proportion of Cape Verdeans and percentage of married-couple family households in the United States with a correlation coefficient (R) of -0.319 and weighted average of 38.1%. Similarly, the statistical analysis conducted on geographies consisting of 148,828,994 people shows a poor negative correlation between the proportion of Afghans and percentage of married-couple family households in the United States with a correlation coefficient (R) of -0.148 and weighted average of 48.0%, a difference of 25.9%.
Married-couple Households Correlation Summary
| Measurement | Cape Verdean | Afghan |
| Minimum | 18.5% | 21.1% |
| Maximum | 59.3% | 74.7% |
| Range | 40.8% | 53.6% |
| Mean | 39.3% | 48.7% |
| Median | 40.1% | 48.8% |
| Interquartile 25% (IQ1) | 32.8% | 43.3% |
| Interquartile 75% (IQ3) | 45.2% | 55.0% |
| Interquartile Range (IQR) | 12.3% | 11.7% |
| Standard Deviation (Sample) | 8.2% | 10.5% |
| Standard Deviation (Population) | 8.2% | 10.5% |
Similar Demographics by Married-couple Households
Demographics Similar to Cape Verdeans by Married-couple Households
In terms of married-couple households, the demographic groups most similar to Cape Verdeans are Dominican (38.2%, a difference of 0.13%), British West Indian (38.3%, a difference of 0.51%), Tohono O'odham (37.9%, a difference of 0.60%), Immigrants from Senegal (38.4%, a difference of 0.63%), and Immigrants from Somalia (38.4%, a difference of 0.79%).
| Demographics | Rating | Rank | Married-couple Households |
| Immigrants | West Indies | 0.0 /100 | #333 | Tragic 39.0% |
| Immigrants | St. Vincent and the Grenadines | 0.0 /100 | #334 | Tragic 38.7% |
| Senegalese | 0.0 /100 | #335 | Tragic 38.6% |
| Blacks/African Americans | 0.0 /100 | #336 | Tragic 38.5% |
| Immigrants | Somalia | 0.0 /100 | #337 | Tragic 38.4% |
| Immigrants | Senegal | 0.0 /100 | #338 | Tragic 38.4% |
| British West Indians | 0.0 /100 | #339 | Tragic 38.3% |
| Dominicans | 0.0 /100 | #340 | Tragic 38.2% |
| Cape Verdeans | 0.0 /100 | #341 | Tragic 38.1% |
| Tohono O'odham | 0.0 /100 | #342 | Tragic 37.9% |
| Immigrants | Grenada | 0.0 /100 | #343 | Tragic 37.5% |
| Immigrants | Dominican Republic | 0.0 /100 | #344 | Tragic 37.3% |
| Hopi | 0.0 /100 | #345 | Tragic 36.7% |
| Immigrants | Cabo Verde | 0.0 /100 | #346 | Tragic 36.2% |
| Pima | 0.0 /100 | #347 | Tragic 35.6% |
Demographics Similar to Afghans by Married-couple Households
In terms of married-couple households, the demographic groups most similar to Afghans are Immigrants from Ireland (48.0%, a difference of 0.0%), Belgian (48.0%, a difference of 0.020%), Cypriot (48.0%, a difference of 0.030%), Immigrants from Israel (48.0%, a difference of 0.040%), and French (48.0%, a difference of 0.040%).
| Demographics | Rating | Rank | Married-couple Households |
| Finns | 98.0 /100 | #81 | Exceptional 48.1% |
| Immigrants | Poland | 97.7 /100 | #82 | Exceptional 48.1% |
| Guamanians/Chamorros | 97.6 /100 | #83 | Exceptional 48.1% |
| Ukrainians | 97.6 /100 | #84 | Exceptional 48.1% |
| Immigrants | Israel | 97.4 /100 | #85 | Exceptional 48.0% |
| Belgians | 97.4 /100 | #86 | Exceptional 48.0% |
| Immigrants | Ireland | 97.3 /100 | #87 | Exceptional 48.0% |
| Afghans | 97.3 /100 | #88 | Exceptional 48.0% |
| Cypriots | 97.2 /100 | #89 | Exceptional 48.0% |
| French | 97.2 /100 | #90 | Exceptional 48.0% |
| Immigrants | Moldova | 97.0 /100 | #91 | Exceptional 48.0% |
| Palestinians | 96.9 /100 | #92 | Exceptional 48.0% |
| Lebanese | 96.9 /100 | #93 | Exceptional 47.9% |
| Americans | 96.9 /100 | #94 | Exceptional 47.9% |
| Immigrants | Belgium | 96.8 /100 | #95 | Exceptional 47.9% |