Canadian vs Navajo Average Family Size
COMPARE
Canadian
Navajo
Average Family Size
Average Family Size Comparison
Canadians
Navajo
3.14
AVERAGE FAMILY SIZE
0.2/ 100
METRIC RATING
299th/ 347
METRIC RANK
3.65
AVERAGE FAMILY SIZE
100.0/ 100
METRIC RATING
5th/ 347
METRIC RANK
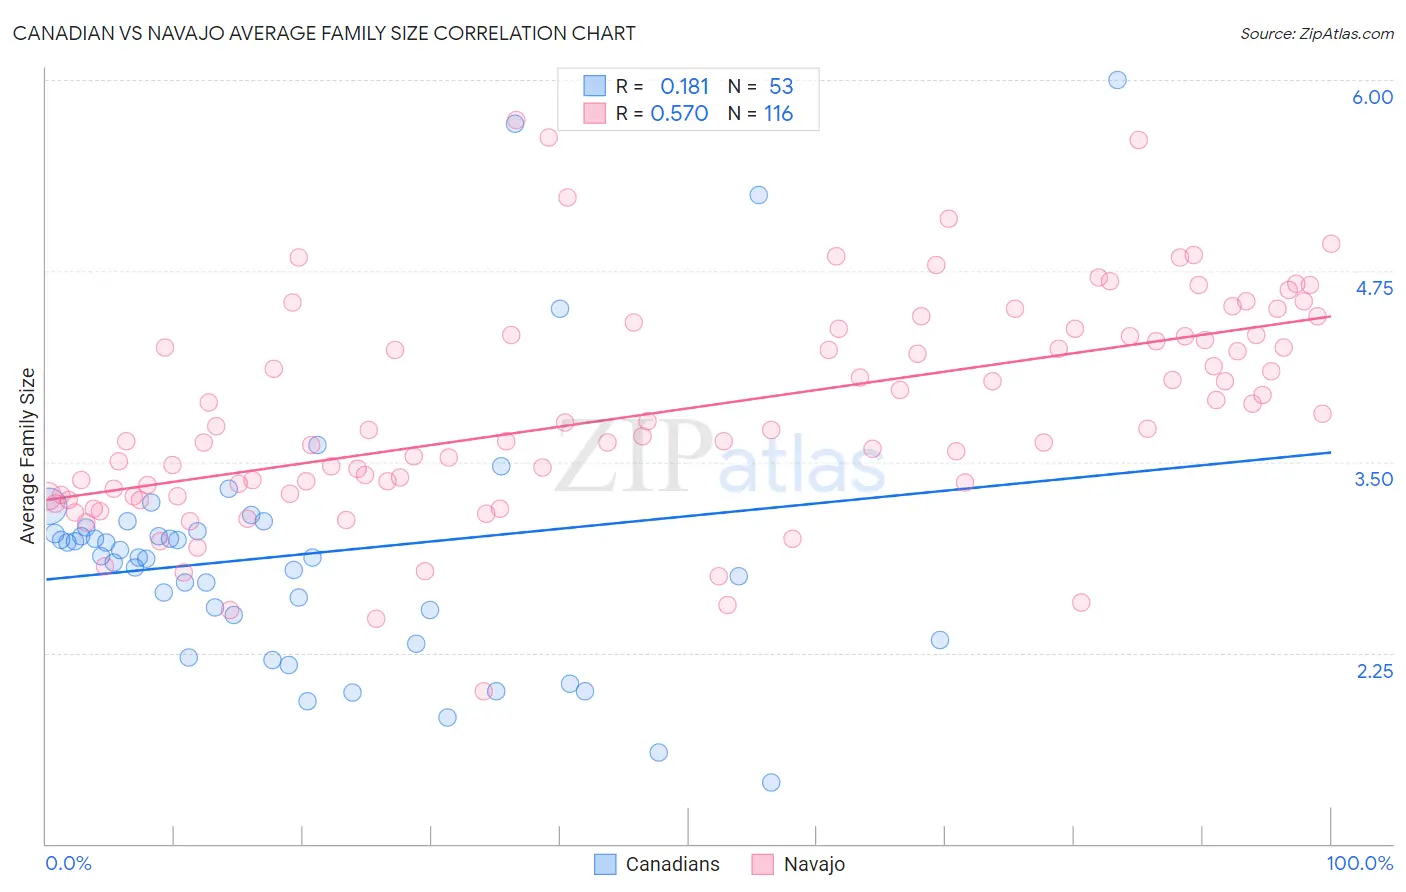
Canadian vs Navajo Average Family Size Correlation Chart
The statistical analysis conducted on geographies consisting of 437,289,019 people shows a poor positive correlation between the proportion of Canadians and average family size in the United States with a correlation coefficient (R) of 0.181 and weighted average of 3.14. Similarly, the statistical analysis conducted on geographies consisting of 224,751,330 people shows a substantial positive correlation between the proportion of Navajo and average family size in the United States with a correlation coefficient (R) of 0.570 and weighted average of 3.65, a difference of 16.2%.
Average Family Size Correlation Summary
| Measurement | Canadian | Navajo |
| Minimum | 1.40 | 2.00 |
| Maximum | 6.00 | 5.74 |
| Range | 4.60 | 3.74 |
| Mean | 2.90 | 3.83 |
| Median | 2.87 | 3.71 |
| Interquartile 25% (IQ1) | 2.42 | 3.31 |
| Interquartile 75% (IQ3) | 3.06 | 4.33 |
| Interquartile Range (IQR) | 0.64 | 1.03 |
| Standard Deviation (Sample) | 0.87 | 0.71 |
| Standard Deviation (Population) | 0.86 | 0.71 |
Similar Demographics by Average Family Size
Demographics Similar to Canadians by Average Family Size
In terms of average family size, the demographic groups most similar to Canadians are Immigrants from Sweden (3.14, a difference of 0.010%), Austrian (3.14, a difference of 0.050%), Ukrainian (3.14, a difference of 0.050%), Immigrants from Western Europe (3.14, a difference of 0.050%), and Colville (3.14, a difference of 0.050%).
| Demographics | Rating | Rank | Average Family Size |
| Europeans | 0.2 /100 | #292 | Tragic 3.14 |
| Scandinavians | 0.2 /100 | #293 | Tragic 3.14 |
| Immigrants | Croatia | 0.2 /100 | #294 | Tragic 3.14 |
| Austrians | 0.2 /100 | #295 | Tragic 3.14 |
| Ukrainians | 0.2 /100 | #296 | Tragic 3.14 |
| Immigrants | Western Europe | 0.2 /100 | #297 | Tragic 3.14 |
| Colville | 0.2 /100 | #298 | Tragic 3.14 |
| Canadians | 0.2 /100 | #299 | Tragic 3.14 |
| Immigrants | Sweden | 0.2 /100 | #300 | Tragic 3.14 |
| Macedonians | 0.2 /100 | #301 | Tragic 3.13 |
| Immigrants | Latvia | 0.2 /100 | #302 | Tragic 3.13 |
| British | 0.2 /100 | #303 | Tragic 3.13 |
| Immigrants | Switzerland | 0.2 /100 | #304 | Tragic 3.13 |
| Australians | 0.1 /100 | #305 | Tragic 3.13 |
| Immigrants | Ireland | 0.1 /100 | #306 | Tragic 3.13 |
Demographics Similar to Navajo by Average Family Size
In terms of average family size, the demographic groups most similar to Navajo are Arapaho (3.64, a difference of 0.27%), Inupiat (3.63, a difference of 0.48%), Immigrants from Yemen (3.60, a difference of 1.3%), Hopi (3.60, a difference of 1.4%), and Spanish American Indian (3.58, a difference of 1.7%).
| Demographics | Rating | Rank | Average Family Size |
| Yup'ik | 100 /100 | #1 | Exceptional 4.00 |
| Crow | 100 /100 | #2 | Exceptional 3.82 |
| Pueblo | 100 /100 | #3 | Exceptional 3.79 |
| Pima | 100 /100 | #4 | Exceptional 3.75 |
| Navajo | 100.0 /100 | #5 | Exceptional 3.65 |
| Arapaho | 100.0 /100 | #6 | Exceptional 3.64 |
| Inupiat | 100.0 /100 | #7 | Exceptional 3.63 |
| Immigrants | Yemen | 100.0 /100 | #8 | Exceptional 3.60 |
| Hopi | 100.0 /100 | #9 | Exceptional 3.60 |
| Spanish American Indians | 100.0 /100 | #10 | Exceptional 3.58 |
| Tohono O'odham | 100.0 /100 | #11 | Exceptional 3.53 |
| Immigrants | Mexico | 100.0 /100 | #12 | Exceptional 3.52 |
| Sioux | 100.0 /100 | #13 | Exceptional 3.52 |
| Immigrants | Central America | 100.0 /100 | #14 | Exceptional 3.49 |
| Tongans | 100.0 /100 | #15 | Exceptional 3.49 |