Canadian vs Israeli Single Mother Households
COMPARE
Canadian
Israeli
Single Mother Households
Single Mother Households Comparison
Canadians
Israelis
5.9%
SINGLE MOTHER HOUSEHOLDS
90.5/ 100
METRIC RATING
134th/ 347
METRIC RANK
5.7%
SINGLE MOTHER HOUSEHOLDS
97.4/ 100
METRIC RATING
88th/ 347
METRIC RANK
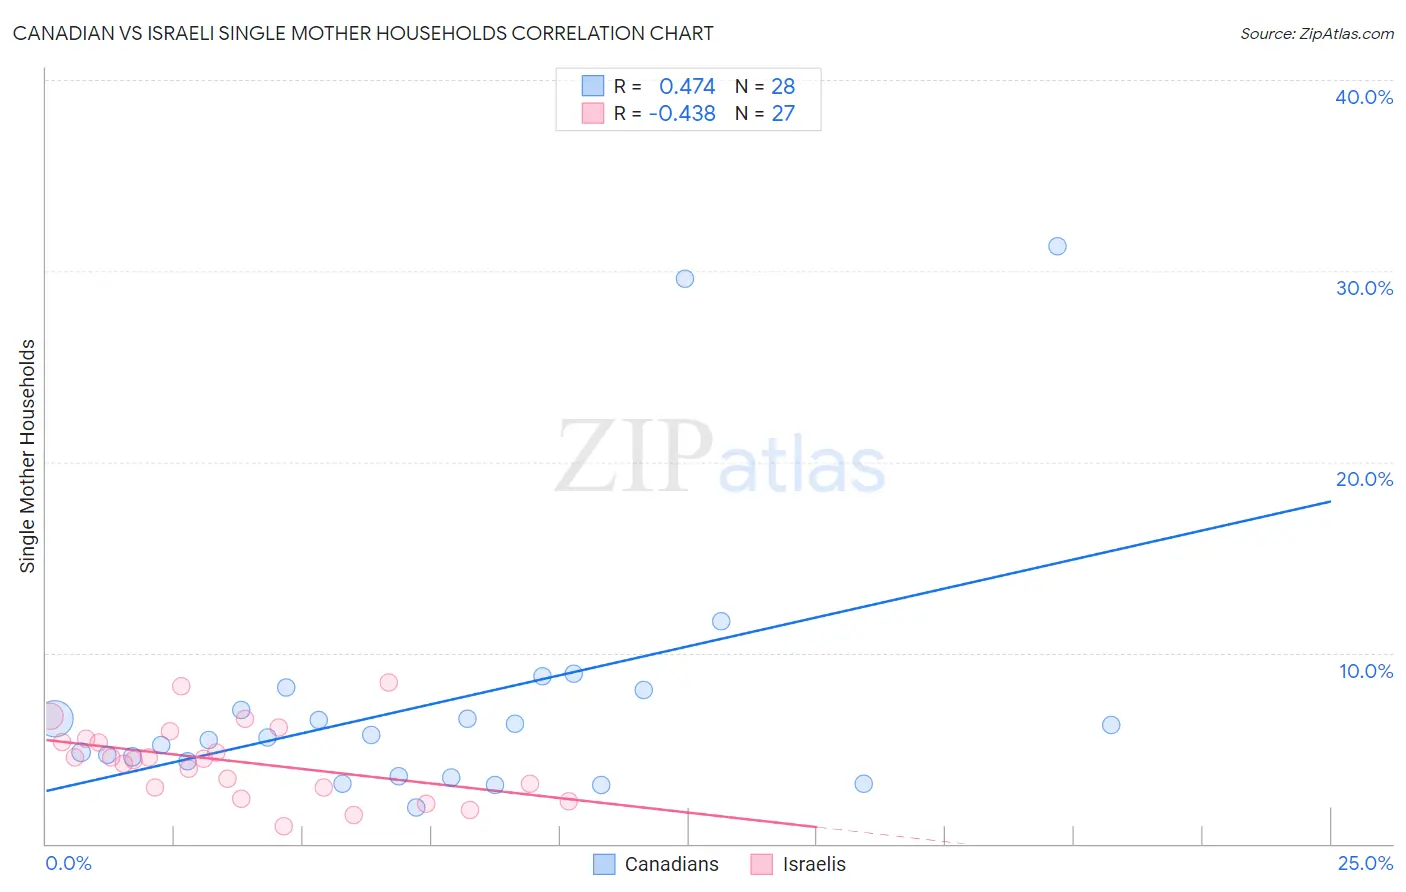
Canadian vs Israeli Single Mother Households Correlation Chart
The statistical analysis conducted on geographies consisting of 435,747,557 people shows a moderate positive correlation between the proportion of Canadians and percentage of single mother households in the United States with a correlation coefficient (R) of 0.474 and weighted average of 5.9%. Similarly, the statistical analysis conducted on geographies consisting of 210,568,675 people shows a moderate negative correlation between the proportion of Israelis and percentage of single mother households in the United States with a correlation coefficient (R) of -0.438 and weighted average of 5.7%, a difference of 4.2%.
Single Mother Households Correlation Summary
| Measurement | Canadian | Israeli |
| Minimum | 1.9% | 0.95% |
| Maximum | 31.3% | 8.5% |
| Range | 29.4% | 7.5% |
| Mean | 7.4% | 4.3% |
| Median | 5.7% | 4.4% |
| Interquartile 25% (IQ1) | 3.9% | 3.0% |
| Interquartile 75% (IQ3) | 7.6% | 5.5% |
| Interquartile Range (IQR) | 3.6% | 2.6% |
| Standard Deviation (Sample) | 6.9% | 1.9% |
| Standard Deviation (Population) | 6.7% | 1.9% |
Similar Demographics by Single Mother Households
Demographics Similar to Canadians by Single Mother Households
In terms of single mother households, the demographic groups most similar to Canadians are Egyptian (5.9%, a difference of 0.060%), Immigrants from Saudi Arabia (5.9%, a difference of 0.090%), Albanian (5.9%, a difference of 0.22%), Immigrants from Spain (5.9%, a difference of 0.26%), and Jordanian (6.0%, a difference of 0.51%).
| Demographics | Rating | Rank | Single Mother Households |
| Lebanese | 92.4 /100 | #127 | Exceptional 5.9% |
| Czechoslovakians | 92.2 /100 | #128 | Exceptional 5.9% |
| Immigrants | Bolivia | 92.2 /100 | #129 | Exceptional 5.9% |
| Palestinians | 92.1 /100 | #130 | Exceptional 5.9% |
| Immigrants | Spain | 91.2 /100 | #131 | Exceptional 5.9% |
| Albanians | 91.1 /100 | #132 | Exceptional 5.9% |
| Egyptians | 90.7 /100 | #133 | Exceptional 5.9% |
| Canadians | 90.5 /100 | #134 | Exceptional 5.9% |
| Immigrants | Saudi Arabia | 90.2 /100 | #135 | Exceptional 5.9% |
| Jordanians | 88.9 /100 | #136 | Excellent 6.0% |
| Immigrants | Pakistan | 88.4 /100 | #137 | Excellent 6.0% |
| Icelanders | 86.9 /100 | #138 | Excellent 6.0% |
| Syrians | 86.0 /100 | #139 | Excellent 6.0% |
| French | 85.7 /100 | #140 | Excellent 6.0% |
| Tsimshian | 85.2 /100 | #141 | Excellent 6.0% |
Demographics Similar to Israelis by Single Mother Households
In terms of single mother households, the demographic groups most similar to Israelis are Immigrants from Turkey (5.7%, a difference of 0.070%), Finnish (5.7%, a difference of 0.15%), Hungarian (5.7%, a difference of 0.18%), Ukrainian (5.7%, a difference of 0.26%), and Immigrants from Indonesia (5.7%, a difference of 0.32%).
| Demographics | Rating | Rank | Single Mother Households |
| Immigrants | Moldova | 97.9 /100 | #81 | Exceptional 5.6% |
| Immigrants | Malaysia | 97.8 /100 | #82 | Exceptional 5.7% |
| Immigrants | Hungary | 97.8 /100 | #83 | Exceptional 5.7% |
| Carpatho Rusyns | 97.7 /100 | #84 | Exceptional 5.7% |
| Hungarians | 97.6 /100 | #85 | Exceptional 5.7% |
| Finns | 97.6 /100 | #86 | Exceptional 5.7% |
| Immigrants | Turkey | 97.5 /100 | #87 | Exceptional 5.7% |
| Israelis | 97.4 /100 | #88 | Exceptional 5.7% |
| Ukrainians | 97.2 /100 | #89 | Exceptional 5.7% |
| Immigrants | Indonesia | 97.2 /100 | #90 | Exceptional 5.7% |
| Europeans | 97.0 /100 | #91 | Exceptional 5.7% |
| Immigrants | Western Asia | 96.7 /100 | #92 | Exceptional 5.7% |
| Serbians | 96.7 /100 | #93 | Exceptional 5.7% |
| Basques | 96.7 /100 | #94 | Exceptional 5.7% |
| Slovaks | 96.6 /100 | #95 | Exceptional 5.7% |