Cambodian vs Immigrants from Thailand Average Family Size
COMPARE
Cambodian
Immigrants from Thailand
Average Family Size
Average Family Size Comparison
Cambodians
Immigrants from Thailand
3.15
AVERAGE FAMILY SIZE
0.6/ 100
METRIC RATING
275th/ 347
METRIC RANK
3.27
AVERAGE FAMILY SIZE
93.3/ 100
METRIC RATING
121st/ 347
METRIC RANK
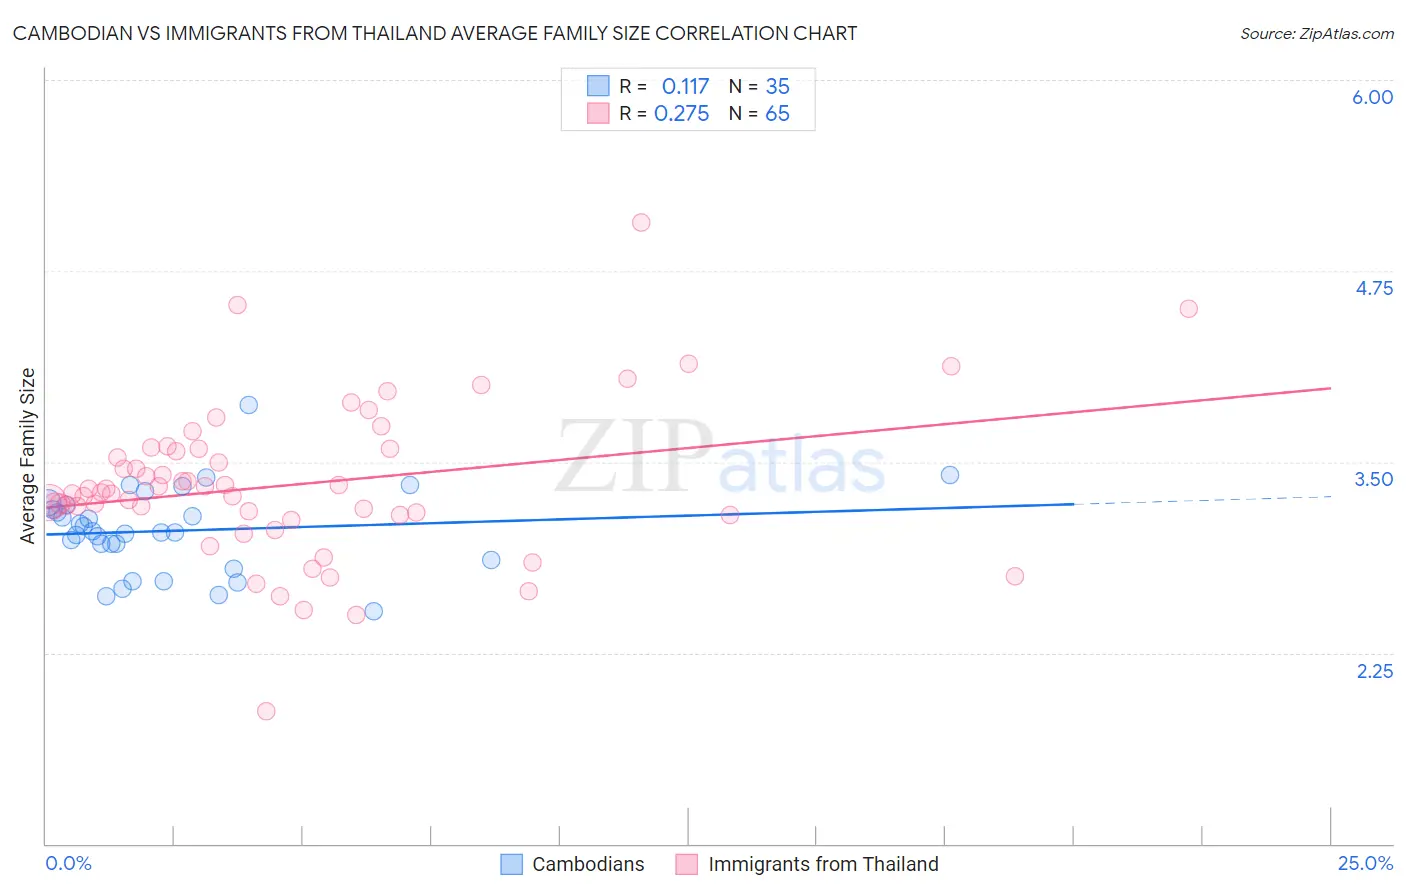
Cambodian vs Immigrants from Thailand Average Family Size Correlation Chart
The statistical analysis conducted on geographies consisting of 102,468,433 people shows a poor positive correlation between the proportion of Cambodians and average family size in the United States with a correlation coefficient (R) of 0.117 and weighted average of 3.15. Similarly, the statistical analysis conducted on geographies consisting of 316,926,842 people shows a weak positive correlation between the proportion of Immigrants from Thailand and average family size in the United States with a correlation coefficient (R) of 0.275 and weighted average of 3.27, a difference of 3.6%.
Average Family Size Correlation Summary
| Measurement | Cambodian | Immigrants from Thailand |
| Minimum | 2.52 | 1.87 |
| Maximum | 3.87 | 5.07 |
| Range | 1.35 | 3.20 |
| Mean | 3.05 | 3.35 |
| Median | 3.04 | 3.30 |
| Interquartile 25% (IQ1) | 2.86 | 3.15 |
| Interquartile 75% (IQ3) | 3.22 | 3.59 |
| Interquartile Range (IQR) | 0.36 | 0.44 |
| Standard Deviation (Sample) | 0.28 | 0.51 |
| Standard Deviation (Population) | 0.27 | 0.51 |
Similar Demographics by Average Family Size
Demographics Similar to Cambodians by Average Family Size
In terms of average family size, the demographic groups most similar to Cambodians are Immigrants from Belgium (3.15, a difference of 0.0%), New Zealander (3.15, a difference of 0.010%), Immigrants from Lithuania (3.15, a difference of 0.020%), Immigrants from Germany (3.15, a difference of 0.040%), and Tlingit-Haida (3.16, a difference of 0.060%).
| Demographics | Rating | Rank | Average Family Size |
| Maltese | 0.8 /100 | #268 | Tragic 3.16 |
| Immigrants | Singapore | 0.7 /100 | #269 | Tragic 3.16 |
| Tlingit-Haida | 0.7 /100 | #270 | Tragic 3.16 |
| Immigrants | Germany | 0.7 /100 | #271 | Tragic 3.15 |
| Immigrants | Lithuania | 0.6 /100 | #272 | Tragic 3.15 |
| New Zealanders | 0.6 /100 | #273 | Tragic 3.15 |
| Immigrants | Belgium | 0.6 /100 | #274 | Tragic 3.15 |
| Cambodians | 0.6 /100 | #275 | Tragic 3.15 |
| Immigrants | Bosnia and Herzegovina | 0.5 /100 | #276 | Tragic 3.15 |
| Swiss | 0.5 /100 | #277 | Tragic 3.15 |
| Okinawans | 0.5 /100 | #278 | Tragic 3.15 |
| Immigrants | Europe | 0.5 /100 | #279 | Tragic 3.15 |
| Immigrants | England | 0.4 /100 | #280 | Tragic 3.15 |
| Immigrants | Denmark | 0.4 /100 | #281 | Tragic 3.15 |
| Yugoslavians | 0.4 /100 | #282 | Tragic 3.15 |
Demographics Similar to Immigrants from Thailand by Average Family Size
In terms of average family size, the demographic groups most similar to Immigrants from Thailand are Immigrants from Bahamas (3.27, a difference of 0.020%), Immigrants from Colombia (3.27, a difference of 0.030%), Immigrants from Indonesia (3.27, a difference of 0.040%), Immigrants from Asia (3.27, a difference of 0.050%), and Alaskan Athabascan (3.27, a difference of 0.060%).
| Demographics | Rating | Rank | Average Family Size |
| South Americans | 95.1 /100 | #114 | Exceptional 3.27 |
| Immigrants | Liberia | 95.0 /100 | #115 | Exceptional 3.27 |
| Immigrants | South America | 95.0 /100 | #116 | Exceptional 3.27 |
| Kiowa | 94.8 /100 | #117 | Exceptional 3.27 |
| Immigrants | Asia | 94.0 /100 | #118 | Exceptional 3.27 |
| Immigrants | Indonesia | 93.7 /100 | #119 | Exceptional 3.27 |
| Immigrants | Bahamas | 93.6 /100 | #120 | Exceptional 3.27 |
| Immigrants | Thailand | 93.3 /100 | #121 | Exceptional 3.27 |
| Immigrants | Colombia | 92.8 /100 | #122 | Exceptional 3.27 |
| Alaskan Athabascans | 92.4 /100 | #123 | Exceptional 3.27 |
| South American Indians | 91.6 /100 | #124 | Exceptional 3.26 |
| Immigrants | Cuba | 91.3 /100 | #125 | Exceptional 3.26 |
| Immigrants | Costa Rica | 90.7 /100 | #126 | Exceptional 3.26 |
| Immigrants | Syria | 90.6 /100 | #127 | Exceptional 3.26 |
| Colombians | 89.9 /100 | #128 | Excellent 3.26 |