Cajun vs Immigrants from El Salvador Family Households with Children

COMPARE

Cajun
Race
Ancestry
AfghanAfricanAlaska NativeAlaskan AthabascanAlbanianAleutAlsatianAmericanApacheArabArapahoArgentineanArmenianAssyrian/Chaldean/SyriacAustralianAustrianBahamianBangladeshiBarbadianBasqueBelgianBelizeanBermudanBhutaneseBlackfeetBolivianBrazilianBritishBritish West IndianBulgarianBurmeseCajunCambodianCanadianCape VerdeanCarpatho RusynCelticCentral AmericanCentral American IndianCherokeeCheyenneChickasawChileanChineseChippewaChoctawColombianColvilleComancheCosta RicanCreeCreekCroatianCrowCubanCypriotCzechCzechoslovakianDanishDelawareDominicanDutchDutch West IndianEastern EuropeanEcuadorianEgyptianEnglishEstonianEthiopianEuropeanFijianFilipinoFinnishFrenchFrench American IndianFrench CanadianGermanGerman RussianGhanaianGreekGuamanian/ChamorroGuatemalanGuyaneseHaitianHmongHonduranHopiHoumaHungarianIcelanderIndian (Asian)IndonesianInupiatIranianIraqiIrishIroquoisIsraeliItalianJamaicanJapaneseJordanianKenyanKiowaKoreanLaotianLatvianLebaneseLiberianLithuanianLumbeeLuxembourgerMacedonianMalaysianMalteseMarshalleseMenomineeMexicanMexican American IndianMongolianMoroccanNative HawaiianNavajoNepaleseNew ZealanderNicaraguanNigerianNorthern EuropeanNorwegianOkinawanOsageOttawaPaiutePakistaniPalestinianPanamanianParaguayanPennsylvania GermanPeruvianPimaPolishPortuguesePotawatomiPuebloPuerto RicanPuget Sound SalishRomanianRussianSalvadoranSamoanScandinavianScotch-IrishScottishSeminoleSenegaleseSerbianShoshoneSierra LeoneanSiouxSlavicSlovakSloveneSomaliSouth AfricanSouth AmericanSouth American IndianSoviet UnionSpaniardSpanishSpanish AmericanSpanish American IndianSri LankanSubsaharan AfricanSudaneseSwedishSwissSyrianTaiwaneseThaiTlingit-HaidaTohono O'OdhamTonganTrinidadian and TobagonianTsimshianTurkishU.S. Virgin IslanderUgandanUkrainianUruguayanUteVenezuelanVietnameseWelshWest IndianYakamaYaquiYugoslavianYumanYup'ikZimbabwean
Immigration
NonimmigrantsImmigrantsAfghanistanAfricaAlbaniaArgentinaArmeniaAsiaAustraliaAustriaBahamasBangladeshBarbadosBelarusBelgiumBelizeBoliviaBosnia and HerzegovinaBrazilBulgariaBurma/MyanmarCabo VerdeCambodiaCameroonCanadaCaribbeanCentral AmericaChileChinaColombiaCongoCosta RicaCroatiaCubaCzechoslovakiaDenmarkDominicaDominican RepublicEastern AfricaEastern AsiaEastern EuropeEcuadorEgyptEnglandEritreaEthiopiaEuropeFijiFranceGermanyGhanaGreeceGrenadaGuatemalaGuyanaHaitiHondurasHong KongHungaryIndiaIndonesiaIranIraqIrelandIsraelItalyJamaicaJapanJordanKazakhstanKenyaKoreaKuwaitLaosLatin AmericaLatviaLebanonLiberiaLithuaniaMalaysiaMexicoMicronesiaMiddle AfricaMoldovaMoroccoNepalNetherlandsNicaraguaNigeriaNorth AmericaNorth MacedoniaNorthern AfricaNorthern EuropeNorwayOceaniaPakistanPanamaPeruPhilippinesPolandPortugalRomaniaRussiaSaudi ArabiaScotlandSenegalSerbiaSierra LeoneSingaporeSomaliaSouth AfricaSouth AmericaSouth Central AsiaSouth Eastern AsiaSouthern EuropeSpainSri LankaSt. Vincent and the GrenadinesSudanSwedenSwitzerlandSyriaTaiwanThailandTrinidad and TobagoTurkeyUgandaUkraineUruguayUzbekistanVenezuelaVietnamWest IndiesWestern AfricaWestern AsiaWestern EuropeYemenZaireZimbabweAzores
Immigrants from El Salvador
Race
Ancestry
AfghanAfricanAlaska NativeAlaskan AthabascanAlbanianAleutAlsatianAmericanApacheArabArapahoArgentineanArmenianAssyrian/Chaldean/SyriacAustralianAustrianBahamianBangladeshiBarbadianBasqueBelgianBelizeanBermudanBhutaneseBlackfeetBolivianBrazilianBritishBritish West IndianBulgarianBurmeseCambodianCanadianCape VerdeanCarpatho RusynCelticCentral AmericanCentral American IndianCherokeeCheyenneChickasawChileanChineseChippewaChoctawColombianColvilleComancheCosta RicanCreeCreekCroatianCrowCubanCypriotCzechCzechoslovakianDanishDelawareDominicanDutchDutch West IndianEastern EuropeanEcuadorianEgyptianEnglishEstonianEthiopianEuropeanFijianFilipinoFinnishFrenchFrench American IndianFrench CanadianGermanGerman RussianGhanaianGreekGuamanian/ChamorroGuatemalanGuyaneseHaitianHmongHonduranHopiHoumaHungarianIcelanderIndian (Asian)IndonesianInupiatIranianIraqiIrishIroquoisIsraeliItalianJamaicanJapaneseJordanianKenyanKiowaKoreanLaotianLatvianLebaneseLiberianLithuanianLumbeeLuxembourgerMacedonianMalaysianMalteseMarshalleseMenomineeMexicanMexican American IndianMongolianMoroccanNative HawaiianNavajoNepaleseNew ZealanderNicaraguanNigerianNorthern EuropeanNorwegianOkinawanOsageOttawaPaiutePakistaniPalestinianPanamanianParaguayanPennsylvania GermanPeruvianPimaPolishPortuguesePotawatomiPuebloPuerto RicanPuget Sound SalishRomanianRussianSalvadoranSamoanScandinavianScotch-IrishScottishSeminoleSenegaleseSerbianShoshoneSierra LeoneanSiouxSlavicSlovakSloveneSomaliSouth AfricanSouth AmericanSouth American IndianSoviet UnionSpaniardSpanishSpanish AmericanSpanish American IndianSri LankanSubsaharan AfricanSudaneseSwedishSwissSyrianTaiwaneseThaiTlingit-HaidaTohono O'OdhamTonganTrinidadian and TobagonianTsimshianTurkishU.S. Virgin IslanderUgandanUkrainianUruguayanUteVenezuelanVietnameseWelshWest IndianYakamaYaquiYugoslavianYumanYup'ikZimbabwean
Immigration
NonimmigrantsImmigrantsAfghanistanAfricaAlbaniaArgentinaArmeniaAsiaAustraliaAustriaBahamasBangladeshBarbadosBelarusBelgiumBelizeBoliviaBosnia and HerzegovinaBrazilBulgariaBurma/MyanmarCabo VerdeCambodiaCameroonCanadaCaribbeanCentral AmericaChileChinaColombiaCongoCosta RicaCroatiaCubaCzechoslovakiaDenmarkDominicaDominican RepublicEastern AfricaEastern AsiaEastern EuropeEcuadorEgyptEl SalvadorEnglandEritreaEthiopiaEuropeFijiFranceGermanyGhanaGreeceGrenadaGuatemalaGuyanaHaitiHondurasHong KongHungaryIndiaIndonesiaIranIraqIrelandIsraelItalyJamaicaJapanJordanKazakhstanKenyaKoreaKuwaitLaosLatin AmericaLatviaLebanonLiberiaLithuaniaMalaysiaMexicoMicronesiaMiddle AfricaMoldovaMoroccoNepalNetherlandsNicaraguaNigeriaNorth AmericaNorth MacedoniaNorthern AfricaNorthern EuropeNorwayOceaniaPakistanPanamaPeruPhilippinesPolandPortugalRomaniaRussiaSaudi ArabiaScotlandSenegalSerbiaSierra LeoneSingaporeSomaliaSouth AfricaSouth AmericaSouth Central AsiaSouth Eastern AsiaSouthern EuropeSpainSri LankaSt. Vincent and the GrenadinesSudanSwedenSwitzerlandSyriaTaiwanThailandTrinidad and TobagoTurkeyUgandaUkraineUruguayUzbekistanVenezuelaVietnamWest IndiesWestern AfricaWestern AsiaWestern EuropeYemenZaireZimbabweAzores
Family Households with Children
Income
Poverty
Unemployment
Labor Participation
Family Structure
Vehicle Availability
Education Level
Disability

Family Households with Children Comparison

Cajuns

Immigrants from El Salvador

Excellent
Exceptional
27.7%
FAMILY HOUSEHOLDS WITH CHILDREN
87.6/ 100
METRIC RATING
130th/ 347
METRIC RANK
29.8%
FAMILY HOUSEHOLDS WITH CHILDREN
100.0/ 100
METRIC RATING
20th/ 347
METRIC RANK

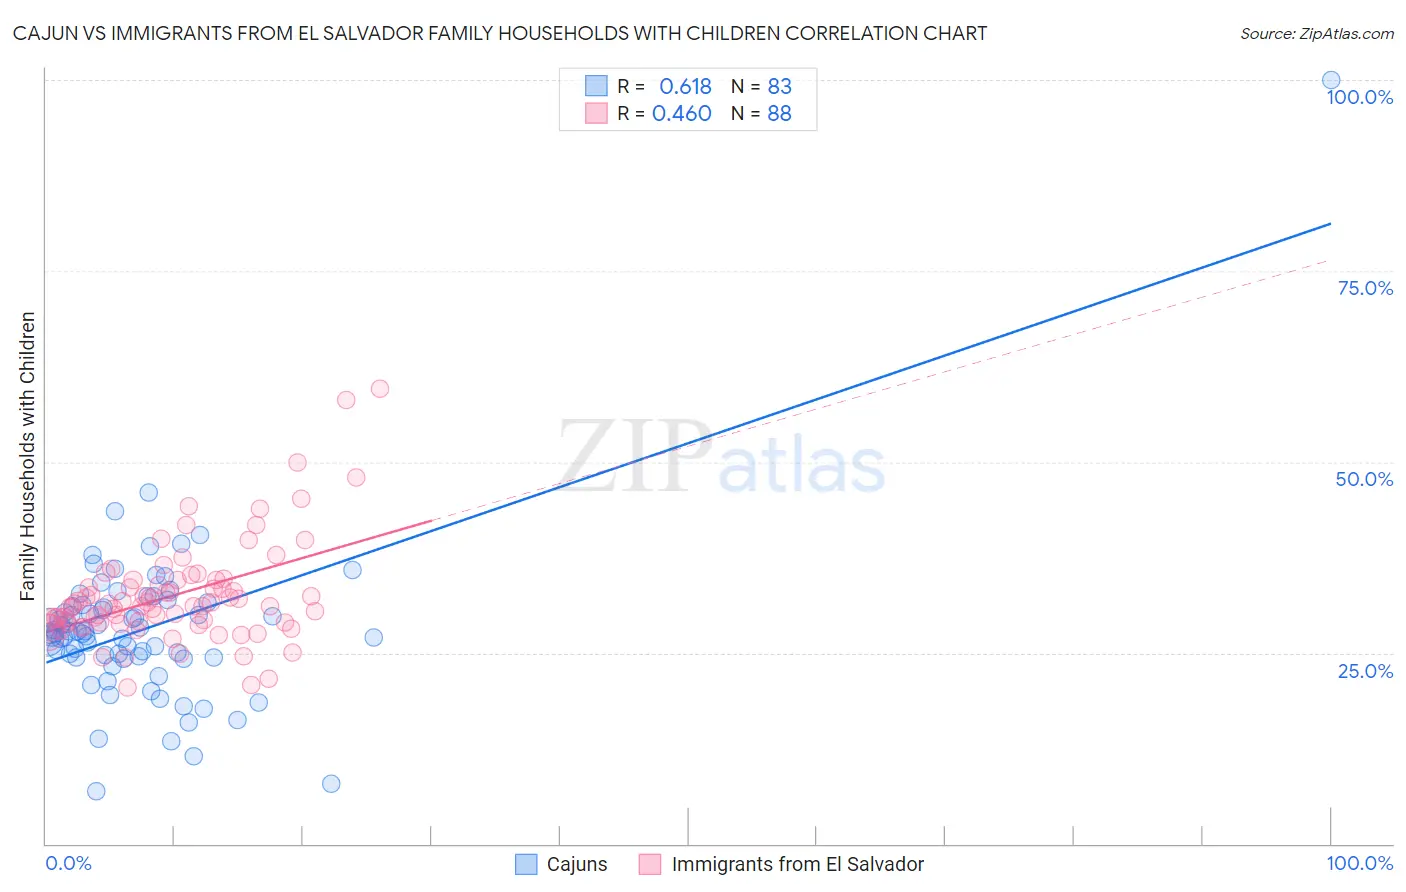
Cajun vs Immigrants from El Salvador Family Households with Children Correlation Chart

The statistical analysis conducted on geographies consisting of 149,693,835 people shows a significant positive correlation between the proportion of Cajuns and percentage of family households with children in the United States with a correlation coefficient (R) of 0.618 and weighted average of 27.7%. Similarly, the statistical analysis conducted on geographies consisting of 357,693,956 people shows a moderate positive correlation between the proportion of Immigrants from El Salvador and percentage of family households with children in the United States with a correlation coefficient (R) of 0.460 and weighted average of 29.8%, a difference of 7.6%.
Cajun vs Immigrants from El Salvador Family Households with Children

Family Households with Children Correlation Summary

MeasurementCajunImmigrants from El Salvador
Minimum6.8%20.5%
Maximum100.0%59.5%
Range93.2%39.0%
Mean28.1%32.6%
Median27.5%31.3%
Interquartile 25% (IQ1)24.4%29.0%
Interquartile 75% (IQ3)31.2%34.5%
Interquartile Range (IQR)6.7%5.5%
Standard Deviation (Sample)10.7%6.7%
Standard Deviation (Population)10.7%6.7%

Similar Demographics by Family Households with Children

Demographics Similar to Cajuns by Family Households with Children

In terms of family households with children, the demographic groups most similar to Cajuns are Lebanese (27.7%, a difference of 0.010%), Immigrants from Eritrea (27.8%, a difference of 0.090%), Immigrants from Belize (27.7%, a difference of 0.090%), Syrian (27.8%, a difference of 0.11%), and Iranian (27.7%, a difference of 0.11%).
DemographicsRating | RankFamily Households with Children
Immigrants | Northern Africa
91.8
/100
|
#123
Exceptional
27.8%
Immigrants | Singapore
90.8
/100
|
#124
Exceptional
27.8%
Ecuadorians
90.8
/100
|
#125
Exceptional
27.8%
Immigrants | Ethiopia
90.5
/100
|
#126
Exceptional
27.8%
Belizeans
90.0
/100
|
#127
Exceptional
27.8%
Syrians
89.7
/100
|
#128
Excellent
27.8%
Immigrants | Eritrea
89.4
/100
|
#129
Excellent
27.8%
Cajuns
87.6
/100
|
#130
Excellent
27.7%
Lebanese
87.4
/100
|
#131
Excellent
27.7%
Immigrants | Belize
85.7
/100
|
#132
Excellent
27.7%
Iranians
85.2
/100
|
#133
Excellent
27.7%
Immigrants | Panama
84.9
/100
|
#134
Excellent
27.7%
Immigrants | Ecuador
84.6
/100
|
#135
Excellent
27.7%
Immigrants | Portugal
84.1
/100
|
#136
Excellent
27.7%
Immigrants | Dominican Republic
83.9
/100
|
#137
Excellent
27.7%

Demographics Similar to Immigrants from El Salvador by Family Households with Children

In terms of family households with children, the demographic groups most similar to Immigrants from El Salvador are Alaska Native (29.9%, a difference of 0.030%), Immigrants from Laos (29.8%, a difference of 0.040%), Salvadoran (29.9%, a difference of 0.070%), Malaysian (29.8%, a difference of 0.080%), and Hispanic or Latino (29.9%, a difference of 0.25%).
DemographicsRating | RankFamily Households with Children
Afghans
100.0
/100
|
#13
Exceptional
30.2%
Bangladeshis
100.0
/100
|
#14
Exceptional
30.1%
Immigrants | South Central Asia
100.0
/100
|
#15
Exceptional
30.0%
Immigrants | Afghanistan
100.0
/100
|
#16
Exceptional
30.0%
Hispanics or Latinos
100.0
/100
|
#17
Exceptional
29.9%
Salvadorans
100.0
/100
|
#18
Exceptional
29.9%
Alaska Natives
100.0
/100
|
#19
Exceptional
29.9%
Immigrants | El Salvador
100.0
/100
|
#20
Exceptional
29.8%
Immigrants | Laos
100.0
/100
|
#21
Exceptional
29.8%
Malaysians
100.0
/100
|
#22
Exceptional
29.8%
Mexican American Indians
100.0
/100
|
#23
Exceptional
29.7%
Guamanians/Chamorros
100.0
/100
|
#24
Exceptional
29.7%
Immigrants | Latin America
100.0
/100
|
#25
Exceptional
29.7%
Sri Lankans
100.0
/100
|
#26
Exceptional
29.5%
Immigrants | Vietnam
100.0
/100
|
#27
Exceptional
29.5%