Burmese vs Chinese Divorced or Separated
COMPARE
Burmese
Chinese
Divorced or Separated
Divorced or Separated Comparison
Burmese
Chinese
10.7%
DIVORCED OR SEPARATED
100.0/ 100
METRIC RATING
20th/ 347
METRIC RANK
11.2%
DIVORCED OR SEPARATED
100.0/ 100
METRIC RATING
42nd/ 347
METRIC RANK
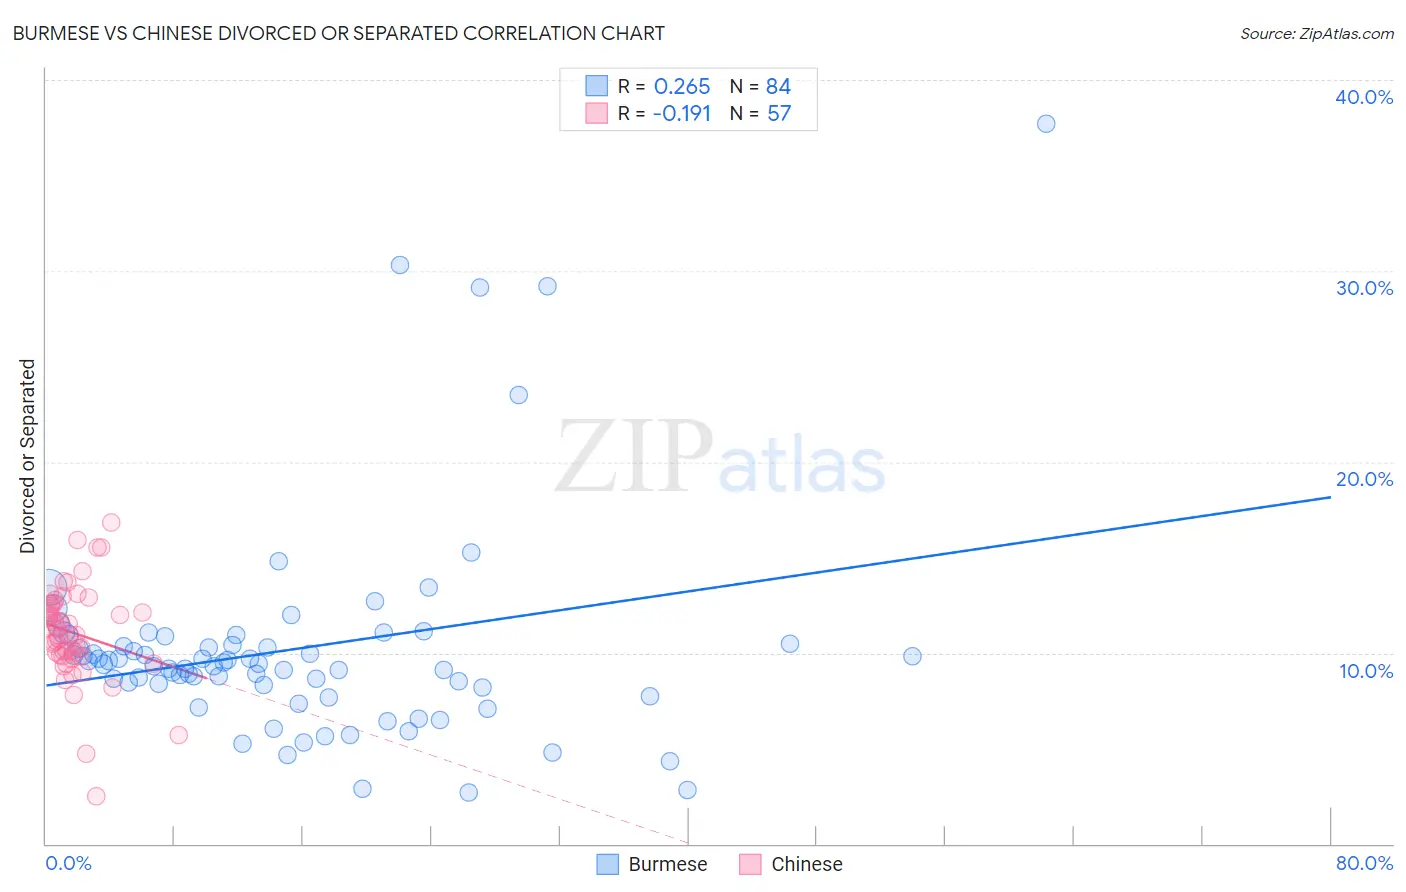
Burmese vs Chinese Divorced or Separated Correlation Chart
The statistical analysis conducted on geographies consisting of 465,063,245 people shows a weak positive correlation between the proportion of Burmese and percentage of population currently divorced or separated in the United States with a correlation coefficient (R) of 0.265 and weighted average of 10.7%. Similarly, the statistical analysis conducted on geographies consisting of 64,808,439 people shows a poor negative correlation between the proportion of Chinese and percentage of population currently divorced or separated in the United States with a correlation coefficient (R) of -0.191 and weighted average of 11.2%, a difference of 4.4%.
Divorced or Separated Correlation Summary
| Measurement | Burmese | Chinese |
| Minimum | 2.7% | 2.5% |
| Maximum | 37.7% | 16.8% |
| Range | 35.0% | 14.3% |
| Mean | 10.2% | 11.1% |
| Median | 9.4% | 11.0% |
| Interquartile 25% (IQ1) | 8.3% | 9.9% |
| Interquartile 75% (IQ3) | 10.4% | 12.5% |
| Interquartile Range (IQR) | 2.2% | 2.6% |
| Standard Deviation (Sample) | 5.7% | 2.5% |
| Standard Deviation (Population) | 5.6% | 2.5% |
Similar Demographics by Divorced or Separated
Demographics Similar to Burmese by Divorced or Separated
In terms of divorced or separated, the demographic groups most similar to Burmese are Immigrants from Asia (10.7%, a difference of 0.18%), Vietnamese (10.8%, a difference of 0.44%), Immigrants from Pakistan (10.8%, a difference of 0.62%), Immigrants from Iran (10.6%, a difference of 0.74%), and Asian (10.6%, a difference of 0.74%).
| Demographics | Rating | Rank | Divorced or Separated |
| Cypriots | 100.0 /100 | #13 | Exceptional 10.5% |
| Assyrians/Chaldeans/Syriacs | 100.0 /100 | #14 | Exceptional 10.6% |
| Immigrants | Armenia | 100.0 /100 | #15 | Exceptional 10.6% |
| Immigrants | Korea | 100.0 /100 | #16 | Exceptional 10.6% |
| Immigrants | Israel | 100.0 /100 | #17 | Exceptional 10.6% |
| Immigrants | Iran | 100.0 /100 | #18 | Exceptional 10.6% |
| Asians | 100.0 /100 | #19 | Exceptional 10.6% |
| Burmese | 100.0 /100 | #20 | Exceptional 10.7% |
| Immigrants | Asia | 100.0 /100 | #21 | Exceptional 10.7% |
| Vietnamese | 100.0 /100 | #22 | Exceptional 10.8% |
| Immigrants | Pakistan | 100.0 /100 | #23 | Exceptional 10.8% |
| Immigrants | Sri Lanka | 100.0 /100 | #24 | Exceptional 10.8% |
| Iranians | 100.0 /100 | #25 | Exceptional 10.8% |
| Immigrants | Indonesia | 100.0 /100 | #26 | Exceptional 10.9% |
| Immigrants | Bangladesh | 100.0 /100 | #27 | Exceptional 11.0% |
Demographics Similar to Chinese by Divorced or Separated
In terms of divorced or separated, the demographic groups most similar to Chinese are Immigrants from Belarus (11.2%, a difference of 0.010%), Immigrants from Western Asia (11.2%, a difference of 0.020%), Bhutanese (11.2%, a difference of 0.060%), Turkish (11.2%, a difference of 0.070%), and Laotian (11.2%, a difference of 0.18%).
| Demographics | Rating | Rank | Divorced or Separated |
| Cambodians | 100.0 /100 | #35 | Exceptional 11.1% |
| Immigrants | Japan | 100.0 /100 | #36 | Exceptional 11.1% |
| Immigrants | Lebanon | 100.0 /100 | #37 | Exceptional 11.1% |
| Immigrants | Greece | 100.0 /100 | #38 | Exceptional 11.1% |
| Immigrants | Egypt | 100.0 /100 | #39 | Exceptional 11.1% |
| Soviet Union | 100.0 /100 | #40 | Exceptional 11.1% |
| Bhutanese | 100.0 /100 | #41 | Exceptional 11.2% |
| Chinese | 100.0 /100 | #42 | Exceptional 11.2% |
| Immigrants | Belarus | 100.0 /100 | #43 | Exceptional 11.2% |
| Immigrants | Western Asia | 100.0 /100 | #44 | Exceptional 11.2% |
| Turks | 100.0 /100 | #45 | Exceptional 11.2% |
| Laotians | 100.0 /100 | #46 | Exceptional 11.2% |
| Immigrants | Poland | 100.0 /100 | #47 | Exceptional 11.2% |
| Immigrants | Turkey | 100.0 /100 | #48 | Exceptional 11.2% |
| Immigrants | Saudi Arabia | 100.0 /100 | #49 | Exceptional 11.2% |