Bulgarian vs Chilean Currently Married
COMPARE
Bulgarian
Chilean
Currently Married
Currently Married Comparison
Bulgarians
Chileans
49.1%
CURRENTLY MARRIED
99.7/ 100
METRIC RATING
22nd/ 347
METRIC RANK
47.0%
CURRENTLY MARRIED
69.8/ 100
METRIC RATING
151st/ 347
METRIC RANK
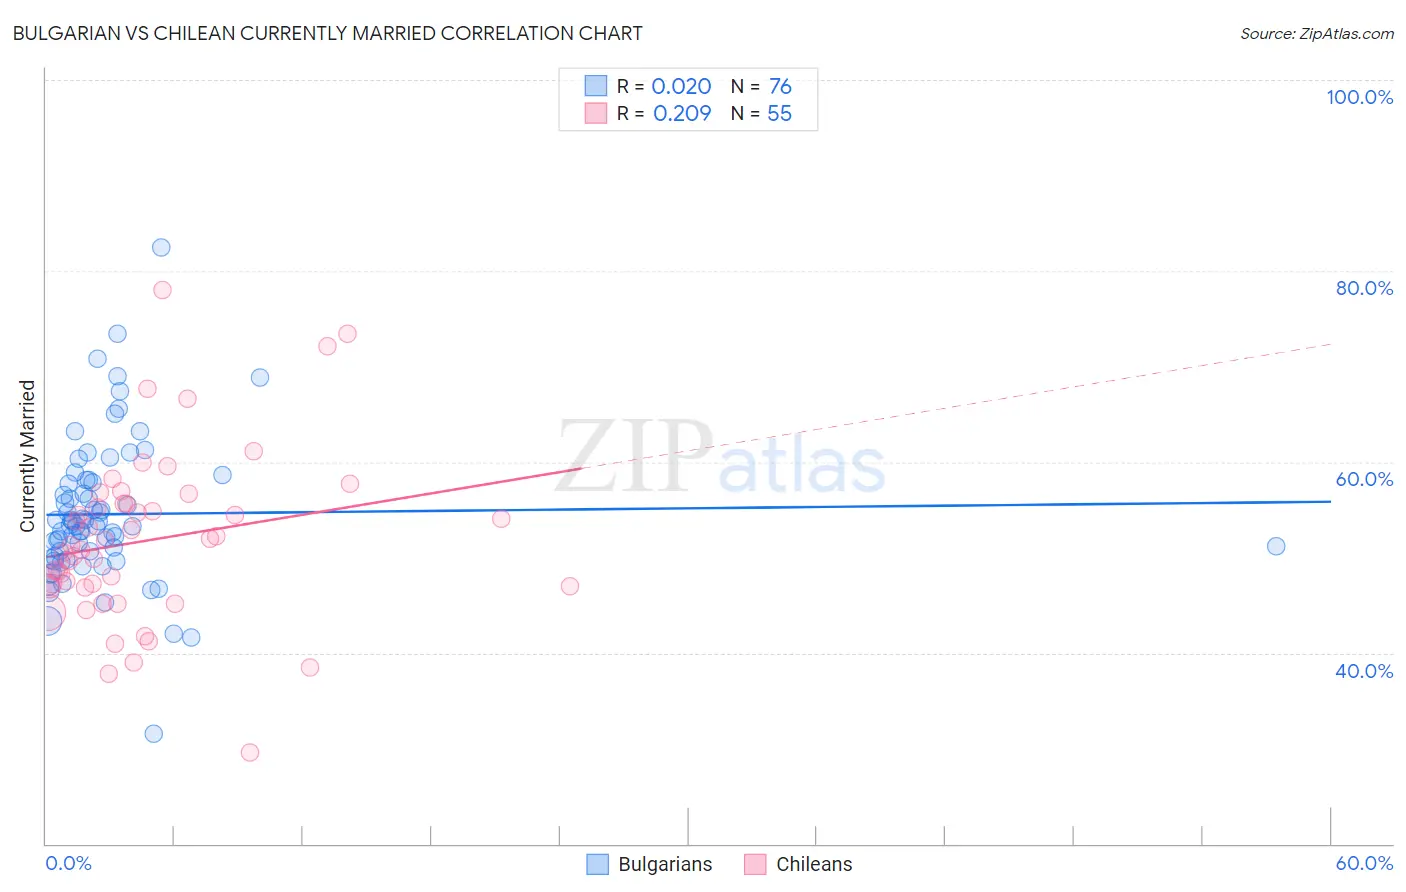
Bulgarian vs Chilean Currently Married Correlation Chart
The statistical analysis conducted on geographies consisting of 205,615,003 people shows no correlation between the proportion of Bulgarians and percentage of population currently married in the United States with a correlation coefficient (R) of 0.020 and weighted average of 49.1%. Similarly, the statistical analysis conducted on geographies consisting of 256,662,716 people shows a weak positive correlation between the proportion of Chileans and percentage of population currently married in the United States with a correlation coefficient (R) of 0.209 and weighted average of 47.0%, a difference of 4.5%.
Currently Married Correlation Summary
| Measurement | Bulgarian | Chilean |
| Minimum | 31.5% | 29.6% |
| Maximum | 82.5% | 78.0% |
| Range | 51.0% | 48.4% |
| Mean | 54.5% | 51.8% |
| Median | 53.3% | 51.2% |
| Interquartile 25% (IQ1) | 49.9% | 46.9% |
| Interquartile 75% (IQ3) | 58.0% | 55.6% |
| Interquartile Range (IQR) | 8.1% | 8.7% |
| Standard Deviation (Sample) | 7.7% | 8.9% |
| Standard Deviation (Population) | 7.6% | 8.8% |
Similar Demographics by Currently Married
Demographics Similar to Bulgarians by Currently Married
In terms of currently married, the demographic groups most similar to Bulgarians are Immigrants from Pakistan (49.1%, a difference of 0.11%), Scottish (49.2%, a difference of 0.22%), Lithuanian (49.0%, a difference of 0.22%), Maltese (49.0%, a difference of 0.23%), and Immigrants from Korea (49.0%, a difference of 0.28%).
| Demographics | Rating | Rank | Currently Married |
| Pennsylvania Germans | 99.9 /100 | #15 | Exceptional 49.6% |
| Chinese | 99.9 /100 | #16 | Exceptional 49.5% |
| Scandinavians | 99.9 /100 | #17 | Exceptional 49.5% |
| Immigrants | Scotland | 99.8 /100 | #18 | Exceptional 49.3% |
| Europeans | 99.8 /100 | #19 | Exceptional 49.3% |
| Luxembourgers | 99.8 /100 | #20 | Exceptional 49.3% |
| Scottish | 99.8 /100 | #21 | Exceptional 49.2% |
| Bulgarians | 99.7 /100 | #22 | Exceptional 49.1% |
| Immigrants | Pakistan | 99.7 /100 | #23 | Exceptional 49.1% |
| Lithuanians | 99.6 /100 | #24 | Exceptional 49.0% |
| Maltese | 99.6 /100 | #25 | Exceptional 49.0% |
| Immigrants | Korea | 99.6 /100 | #26 | Exceptional 49.0% |
| Burmese | 99.6 /100 | #27 | Exceptional 48.9% |
| Welsh | 99.5 /100 | #28 | Exceptional 48.9% |
| Croatians | 99.5 /100 | #29 | Exceptional 48.9% |
Demographics Similar to Chileans by Currently Married
In terms of currently married, the demographic groups most similar to Chileans are Zimbabwean (47.0%, a difference of 0.010%), Immigrants from Turkey (47.0%, a difference of 0.010%), Cambodian (47.0%, a difference of 0.030%), Immigrants from Serbia (47.0%, a difference of 0.040%), and Immigrants from Venezuela (47.0%, a difference of 0.050%).
| Demographics | Rating | Rank | Currently Married |
| Hmong | 73.4 /100 | #144 | Good 47.1% |
| Immigrants | South Eastern Asia | 72.9 /100 | #145 | Good 47.1% |
| Carpatho Rusyns | 72.6 /100 | #146 | Good 47.0% |
| Immigrants | Argentina | 72.0 /100 | #147 | Good 47.0% |
| Cambodians | 70.4 /100 | #148 | Good 47.0% |
| Zimbabweans | 70.1 /100 | #149 | Good 47.0% |
| Immigrants | Turkey | 70.0 /100 | #150 | Good 47.0% |
| Chileans | 69.8 /100 | #151 | Good 47.0% |
| Immigrants | Serbia | 68.8 /100 | #152 | Good 47.0% |
| Immigrants | Venezuela | 68.6 /100 | #153 | Good 47.0% |
| Albanians | 68.6 /100 | #154 | Good 47.0% |
| Arabs | 68.6 /100 | #155 | Good 47.0% |
| Spanish | 68.1 /100 | #156 | Good 47.0% |
| Immigrants | Switzerland | 67.8 /100 | #157 | Good 46.9% |
| Cherokee | 66.8 /100 | #158 | Good 46.9% |