British West Indian vs Malaysian Family Households with Children
COMPARE
British West Indian
Malaysian
Family Households with Children
Family Households with Children Comparison
British West Indians
Malaysians
26.0%
FAMILY HOUSEHOLDS WITH CHILDREN
0.0/ 100
METRIC RATING
321st/ 347
METRIC RANK
29.8%
FAMILY HOUSEHOLDS WITH CHILDREN
100.0/ 100
METRIC RATING
22nd/ 347
METRIC RANK
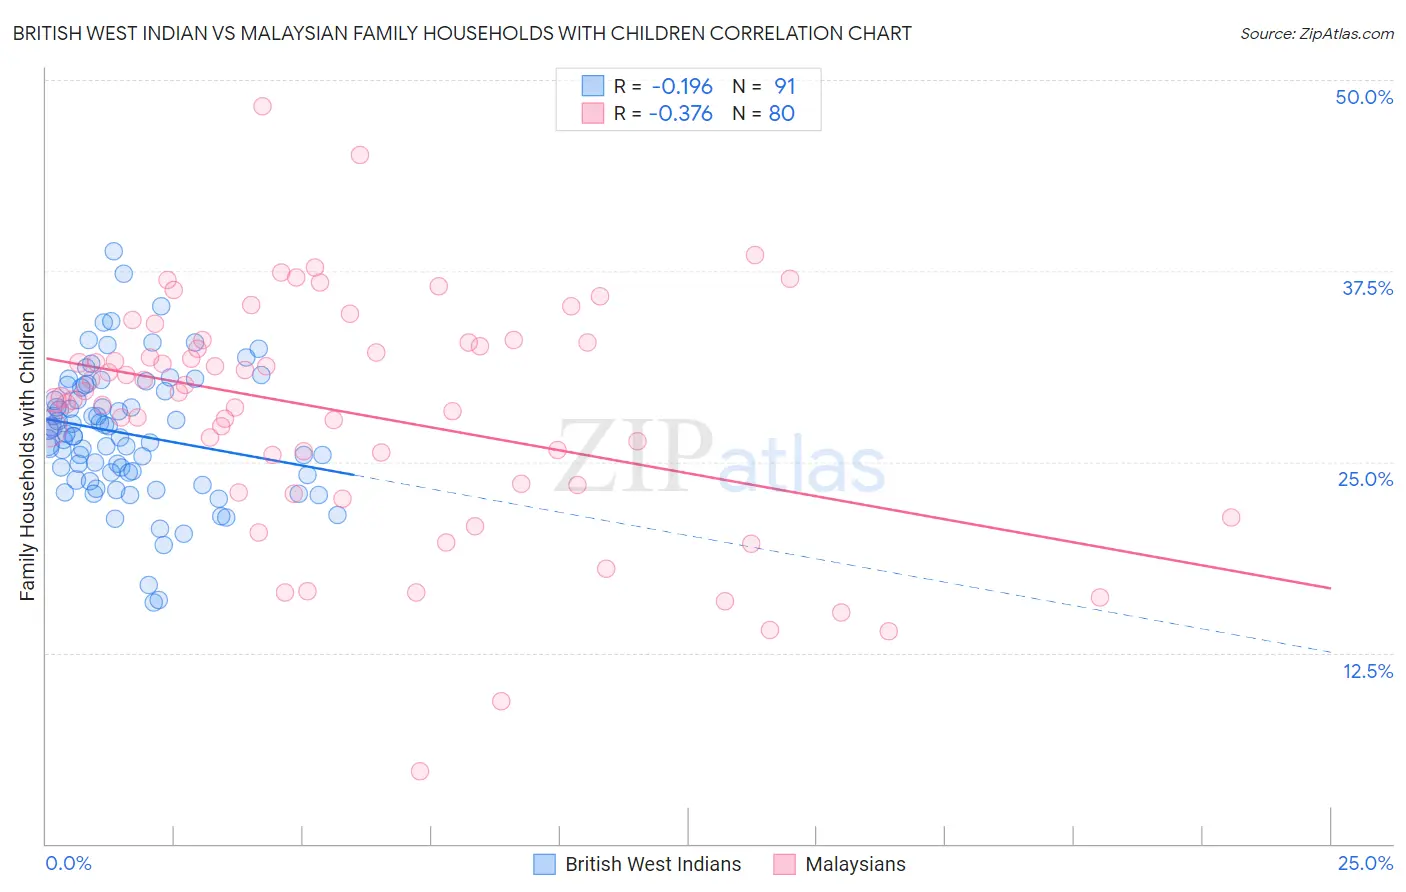
British West Indian vs Malaysian Family Households with Children Correlation Chart
The statistical analysis conducted on geographies consisting of 152,601,999 people shows a poor negative correlation between the proportion of British West Indians and percentage of family households with children in the United States with a correlation coefficient (R) of -0.196 and weighted average of 26.0%. Similarly, the statistical analysis conducted on geographies consisting of 225,942,308 people shows a mild negative correlation between the proportion of Malaysians and percentage of family households with children in the United States with a correlation coefficient (R) of -0.376 and weighted average of 29.8%, a difference of 14.6%.
Family Households with Children Correlation Summary
| Measurement | British West Indian | Malaysian |
| Minimum | 15.8% | 4.8% |
| Maximum | 38.8% | 48.3% |
| Range | 22.9% | 43.6% |
| Mean | 26.8% | 28.2% |
| Median | 26.7% | 29.4% |
| Interquartile 25% (IQ1) | 24.1% | 23.6% |
| Interquartile 75% (IQ3) | 29.9% | 32.8% |
| Interquartile Range (IQR) | 5.8% | 9.3% |
| Standard Deviation (Sample) | 4.3% | 7.7% |
| Standard Deviation (Population) | 4.3% | 7.7% |
Similar Demographics by Family Households with Children
Demographics Similar to British West Indians by Family Households with Children
In terms of family households with children, the demographic groups most similar to British West Indians are Tlingit-Haida (26.0%, a difference of 0.010%), Immigrants from Greece (26.0%, a difference of 0.010%), Immigrants from France (26.0%, a difference of 0.030%), Immigrants from Australia (26.0%, a difference of 0.040%), and Chinese (26.0%, a difference of 0.080%).
| Demographics | Rating | Rank | Family Households with Children |
| French Canadians | 0.0 /100 | #314 | Tragic 26.1% |
| Immigrants | Norway | 0.0 /100 | #315 | Tragic 26.1% |
| Estonians | 0.0 /100 | #316 | Tragic 26.1% |
| Ottawa | 0.0 /100 | #317 | Tragic 26.1% |
| Iroquois | 0.0 /100 | #318 | Tragic 26.1% |
| Immigrants | France | 0.0 /100 | #319 | Tragic 26.0% |
| Tlingit-Haida | 0.0 /100 | #320 | Tragic 26.0% |
| British West Indians | 0.0 /100 | #321 | Tragic 26.0% |
| Immigrants | Greece | 0.0 /100 | #322 | Tragic 26.0% |
| Immigrants | Australia | 0.0 /100 | #323 | Tragic 26.0% |
| Chinese | 0.0 /100 | #324 | Tragic 26.0% |
| Barbadians | 0.0 /100 | #325 | Tragic 26.0% |
| Immigrants | Ireland | 0.0 /100 | #326 | Tragic 26.0% |
| Immigrants | Barbados | 0.0 /100 | #327 | Tragic 26.0% |
| Immigrants | Albania | 0.0 /100 | #328 | Tragic 25.9% |
Demographics Similar to Malaysians by Family Households with Children
In terms of family households with children, the demographic groups most similar to Malaysians are Immigrants from Laos (29.8%, a difference of 0.030%), Immigrants from El Salvador (29.8%, a difference of 0.080%), Alaska Native (29.9%, a difference of 0.11%), Salvadoran (29.9%, a difference of 0.14%), and Mexican American Indian (29.7%, a difference of 0.27%).
| Demographics | Rating | Rank | Family Households with Children |
| Immigrants | South Central Asia | 100.0 /100 | #15 | Exceptional 30.0% |
| Immigrants | Afghanistan | 100.0 /100 | #16 | Exceptional 30.0% |
| Hispanics or Latinos | 100.0 /100 | #17 | Exceptional 29.9% |
| Salvadorans | 100.0 /100 | #18 | Exceptional 29.9% |
| Alaska Natives | 100.0 /100 | #19 | Exceptional 29.9% |
| Immigrants | El Salvador | 100.0 /100 | #20 | Exceptional 29.8% |
| Immigrants | Laos | 100.0 /100 | #21 | Exceptional 29.8% |
| Malaysians | 100.0 /100 | #22 | Exceptional 29.8% |
| Mexican American Indians | 100.0 /100 | #23 | Exceptional 29.7% |
| Guamanians/Chamorros | 100.0 /100 | #24 | Exceptional 29.7% |
| Immigrants | Latin America | 100.0 /100 | #25 | Exceptional 29.7% |
| Sri Lankans | 100.0 /100 | #26 | Exceptional 29.5% |
| Immigrants | Vietnam | 100.0 /100 | #27 | Exceptional 29.5% |
| Samoans | 100.0 /100 | #28 | Exceptional 29.5% |
| Bolivians | 100.0 /100 | #29 | Exceptional 29.5% |