British West Indian vs Central American Indian Married-couple Households
COMPARE
British West Indian
Central American Indian
Married-couple Households
Married-couple Households Comparison
British West Indians
Central American Indians
38.3%
MARRIED-COUPLE HOUSEHOLDS
0.0/ 100
METRIC RATING
339th/ 347
METRIC RANK
43.8%
MARRIED-COUPLE HOUSEHOLDS
0.2/ 100
METRIC RATING
258th/ 347
METRIC RANK
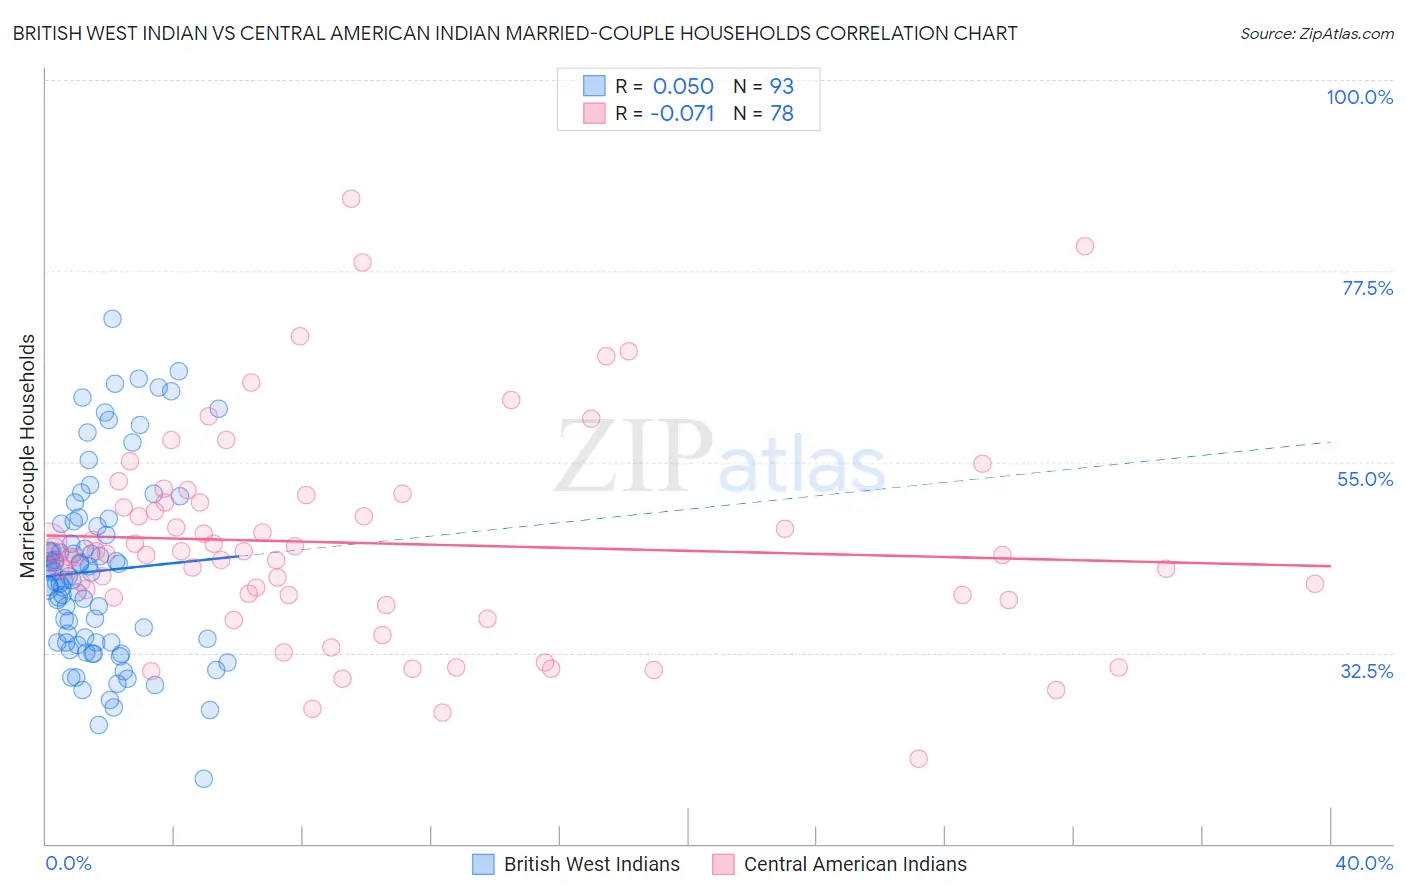
British West Indian vs Central American Indian Married-couple Households Correlation Chart
The statistical analysis conducted on geographies consisting of 152,632,220 people shows no correlation between the proportion of British West Indians and percentage of married-couple family households in the United States with a correlation coefficient (R) of 0.050 and weighted average of 38.3%. Similarly, the statistical analysis conducted on geographies consisting of 326,060,937 people shows a slight negative correlation between the proportion of Central American Indians and percentage of married-couple family households in the United States with a correlation coefficient (R) of -0.071 and weighted average of 43.8%, a difference of 14.2%.
Married-couple Households Correlation Summary
| Measurement | British West Indian | Central American Indian |
| Minimum | 17.7% | 20.1% |
| Maximum | 71.8% | 86.0% |
| Range | 54.1% | 65.9% |
| Mean | 42.1% | 45.4% |
| Median | 41.5% | 44.1% |
| Interquartile 25% (IQ1) | 33.7% | 39.0% |
| Interquartile 75% (IQ3) | 47.6% | 50.2% |
| Interquartile Range (IQR) | 13.8% | 11.3% |
| Standard Deviation (Sample) | 10.9% | 12.5% |
| Standard Deviation (Population) | 10.8% | 12.4% |
Similar Demographics by Married-couple Households
Demographics Similar to British West Indians by Married-couple Households
In terms of married-couple households, the demographic groups most similar to British West Indians are Immigrants from Senegal (38.4%, a difference of 0.13%), Immigrants from Somalia (38.4%, a difference of 0.29%), Dominican (38.2%, a difference of 0.38%), Black/African American (38.5%, a difference of 0.43%), and Cape Verdean (38.1%, a difference of 0.51%).
| Demographics | Rating | Rank | Married-couple Households |
| Somalis | 0.0 /100 | #332 | Tragic 39.0% |
| Immigrants | West Indies | 0.0 /100 | #333 | Tragic 39.0% |
| Immigrants | St. Vincent and the Grenadines | 0.0 /100 | #334 | Tragic 38.7% |
| Senegalese | 0.0 /100 | #335 | Tragic 38.6% |
| Blacks/African Americans | 0.0 /100 | #336 | Tragic 38.5% |
| Immigrants | Somalia | 0.0 /100 | #337 | Tragic 38.4% |
| Immigrants | Senegal | 0.0 /100 | #338 | Tragic 38.4% |
| British West Indians | 0.0 /100 | #339 | Tragic 38.3% |
| Dominicans | 0.0 /100 | #340 | Tragic 38.2% |
| Cape Verdeans | 0.0 /100 | #341 | Tragic 38.1% |
| Tohono O'odham | 0.0 /100 | #342 | Tragic 37.9% |
| Immigrants | Grenada | 0.0 /100 | #343 | Tragic 37.5% |
| Immigrants | Dominican Republic | 0.0 /100 | #344 | Tragic 37.3% |
| Hopi | 0.0 /100 | #345 | Tragic 36.7% |
| Immigrants | Cabo Verde | 0.0 /100 | #346 | Tragic 36.2% |
Demographics Similar to Central American Indians by Married-couple Households
In terms of married-couple households, the demographic groups most similar to Central American Indians are Iroquois (43.7%, a difference of 0.030%), Blackfeet (43.8%, a difference of 0.040%), Immigrants from Cameroon (43.7%, a difference of 0.12%), Ugandan (43.8%, a difference of 0.20%), and Alaskan Athabascan (43.6%, a difference of 0.25%).
| Demographics | Rating | Rank | Married-couple Households |
| German Russians | 0.4 /100 | #251 | Tragic 44.0% |
| Seminole | 0.4 /100 | #252 | Tragic 44.0% |
| Central Americans | 0.3 /100 | #253 | Tragic 43.9% |
| Apache | 0.3 /100 | #254 | Tragic 43.9% |
| Shoshone | 0.3 /100 | #255 | Tragic 43.9% |
| Ugandans | 0.3 /100 | #256 | Tragic 43.8% |
| Blackfeet | 0.2 /100 | #257 | Tragic 43.8% |
| Central American Indians | 0.2 /100 | #258 | Tragic 43.8% |
| Iroquois | 0.2 /100 | #259 | Tragic 43.7% |
| Immigrants | Cameroon | 0.2 /100 | #260 | Tragic 43.7% |
| Alaskan Athabascans | 0.2 /100 | #261 | Tragic 43.6% |
| Vietnamese | 0.2 /100 | #262 | Tragic 43.6% |
| Cree | 0.1 /100 | #263 | Tragic 43.6% |
| Bangladeshis | 0.1 /100 | #264 | Tragic 43.5% |
| Moroccans | 0.1 /100 | #265 | Tragic 43.5% |