Bolivian vs Immigrants from Uzbekistan Births to Unmarried Women
COMPARE
Bolivian
Immigrants from Uzbekistan
Births to Unmarried Women
Births to Unmarried Women Comparison
Bolivians
Immigrants from Uzbekistan
28.5%
BIRTHS TO UNMARRIED WOMEN
98.7/ 100
METRIC RATING
69th/ 347
METRIC RANK
25.8%
BIRTHS TO UNMARRIED WOMEN
100.0/ 100
METRIC RATING
17th/ 347
METRIC RANK
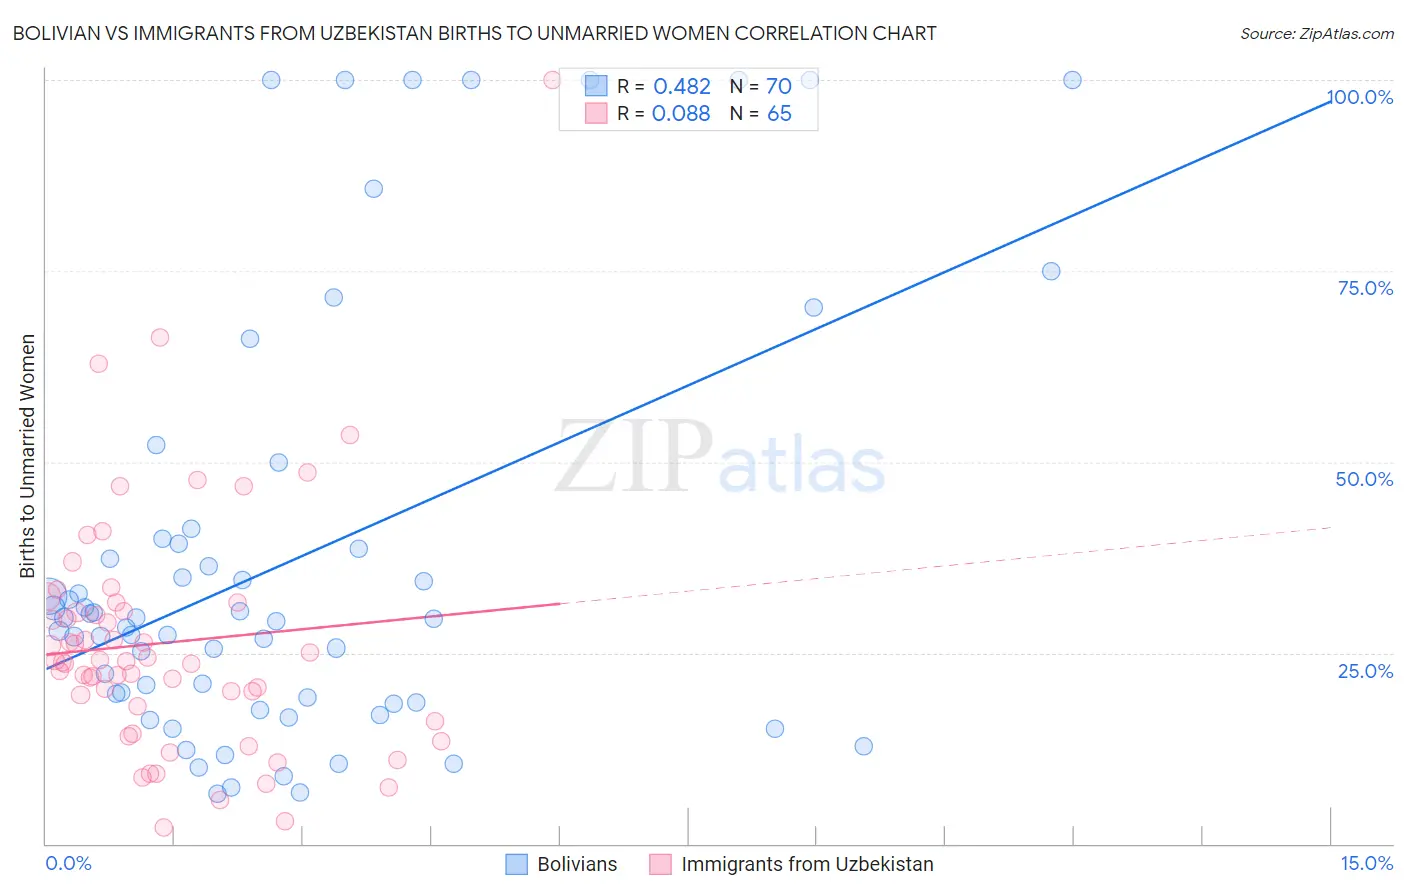
Bolivian vs Immigrants from Uzbekistan Births to Unmarried Women Correlation Chart
The statistical analysis conducted on geographies consisting of 177,966,984 people shows a moderate positive correlation between the proportion of Bolivians and percentage of births to unmarried women in the United States with a correlation coefficient (R) of 0.482 and weighted average of 28.5%. Similarly, the statistical analysis conducted on geographies consisting of 114,110,355 people shows a slight positive correlation between the proportion of Immigrants from Uzbekistan and percentage of births to unmarried women in the United States with a correlation coefficient (R) of 0.088 and weighted average of 25.8%, a difference of 10.3%.
Births to Unmarried Women Correlation Summary
| Measurement | Bolivian | Immigrants from Uzbekistan |
| Minimum | 6.5% | 2.0% |
| Maximum | 100.0% | 100.0% |
| Range | 93.5% | 98.0% |
| Mean | 37.1% | 26.3% |
| Median | 29.4% | 23.9% |
| Interquartile 25% (IQ1) | 18.5% | 17.0% |
| Interquartile 75% (IQ3) | 39.3% | 31.0% |
| Interquartile Range (IQR) | 20.8% | 14.0% |
| Standard Deviation (Sample) | 27.8% | 16.2% |
| Standard Deviation (Population) | 27.6% | 16.0% |
Similar Demographics by Births to Unmarried Women
Demographics Similar to Bolivians by Births to Unmarried Women
In terms of births to unmarried women, the demographic groups most similar to Bolivians are Immigrants from Europe (28.4%, a difference of 0.040%), Laotian (28.5%, a difference of 0.060%), Palestinian (28.4%, a difference of 0.090%), Immigrants from Egypt (28.4%, a difference of 0.20%), and Immigrants from Czechoslovakia (28.4%, a difference of 0.22%).
| Demographics | Rating | Rank | Births to Unmarried Women |
| Egyptians | 99.0 /100 | #62 | Exceptional 28.2% |
| Immigrants | Serbia | 98.9 /100 | #63 | Exceptional 28.3% |
| Tongans | 98.8 /100 | #64 | Exceptional 28.4% |
| Immigrants | Czechoslovakia | 98.8 /100 | #65 | Exceptional 28.4% |
| Immigrants | Egypt | 98.8 /100 | #66 | Exceptional 28.4% |
| Palestinians | 98.7 /100 | #67 | Exceptional 28.4% |
| Immigrants | Europe | 98.7 /100 | #68 | Exceptional 28.4% |
| Bolivians | 98.7 /100 | #69 | Exceptional 28.5% |
| Laotians | 98.6 /100 | #70 | Exceptional 28.5% |
| Jordanians | 98.5 /100 | #71 | Exceptional 28.5% |
| Immigrants | Sweden | 98.5 /100 | #72 | Exceptional 28.5% |
| Albanians | 98.5 /100 | #73 | Exceptional 28.5% |
| Immigrants | Bolivia | 98.5 /100 | #74 | Exceptional 28.6% |
| Immigrants | Switzerland | 98.4 /100 | #75 | Exceptional 28.6% |
| Israelis | 98.4 /100 | #76 | Exceptional 28.6% |
Demographics Similar to Immigrants from Uzbekistan by Births to Unmarried Women
In terms of births to unmarried women, the demographic groups most similar to Immigrants from Uzbekistan are Immigrants from Belarus (25.6%, a difference of 0.57%), Immigrants from Singapore (25.6%, a difference of 0.62%), Immigrants from Armenia (26.1%, a difference of 1.1%), Armenian (26.2%, a difference of 1.7%), and Immigrants from Lebanon (25.3%, a difference of 1.8%).
| Demographics | Rating | Rank | Births to Unmarried Women |
| Immigrants | Eastern Asia | 100.0 /100 | #10 | Exceptional 25.0% |
| Immigrants | Israel | 100.0 /100 | #11 | Exceptional 25.1% |
| Indians (Asian) | 100.0 /100 | #12 | Exceptional 25.3% |
| Iranians | 100.0 /100 | #13 | Exceptional 25.3% |
| Immigrants | Lebanon | 100.0 /100 | #14 | Exceptional 25.3% |
| Immigrants | Singapore | 100.0 /100 | #15 | Exceptional 25.6% |
| Immigrants | Belarus | 100.0 /100 | #16 | Exceptional 25.6% |
| Immigrants | Uzbekistan | 100.0 /100 | #17 | Exceptional 25.8% |
| Immigrants | Armenia | 99.9 /100 | #18 | Exceptional 26.1% |
| Armenians | 99.9 /100 | #19 | Exceptional 26.2% |
| Immigrants | Korea | 99.9 /100 | #20 | Exceptional 26.3% |
| Soviet Union | 99.9 /100 | #21 | Exceptional 26.3% |
| Burmese | 99.9 /100 | #22 | Exceptional 26.4% |
| Immigrants | Japan | 99.9 /100 | #23 | Exceptional 26.4% |
| Immigrants | Australia | 99.9 /100 | #24 | Exceptional 26.6% |