Blackfeet vs Immigrants from Jordan Births to Unmarried Women
COMPARE
Blackfeet
Immigrants from Jordan
Births to Unmarried Women
Births to Unmarried Women Comparison
Blackfeet
Immigrants from Jordan
37.9%
BIRTHS TO UNMARRIED WOMEN
0.0/ 100
METRIC RATING
292nd/ 347
METRIC RANK
29.0%
BIRTHS TO UNMARRIED WOMEN
97.4/ 100
METRIC RATING
86th/ 347
METRIC RANK
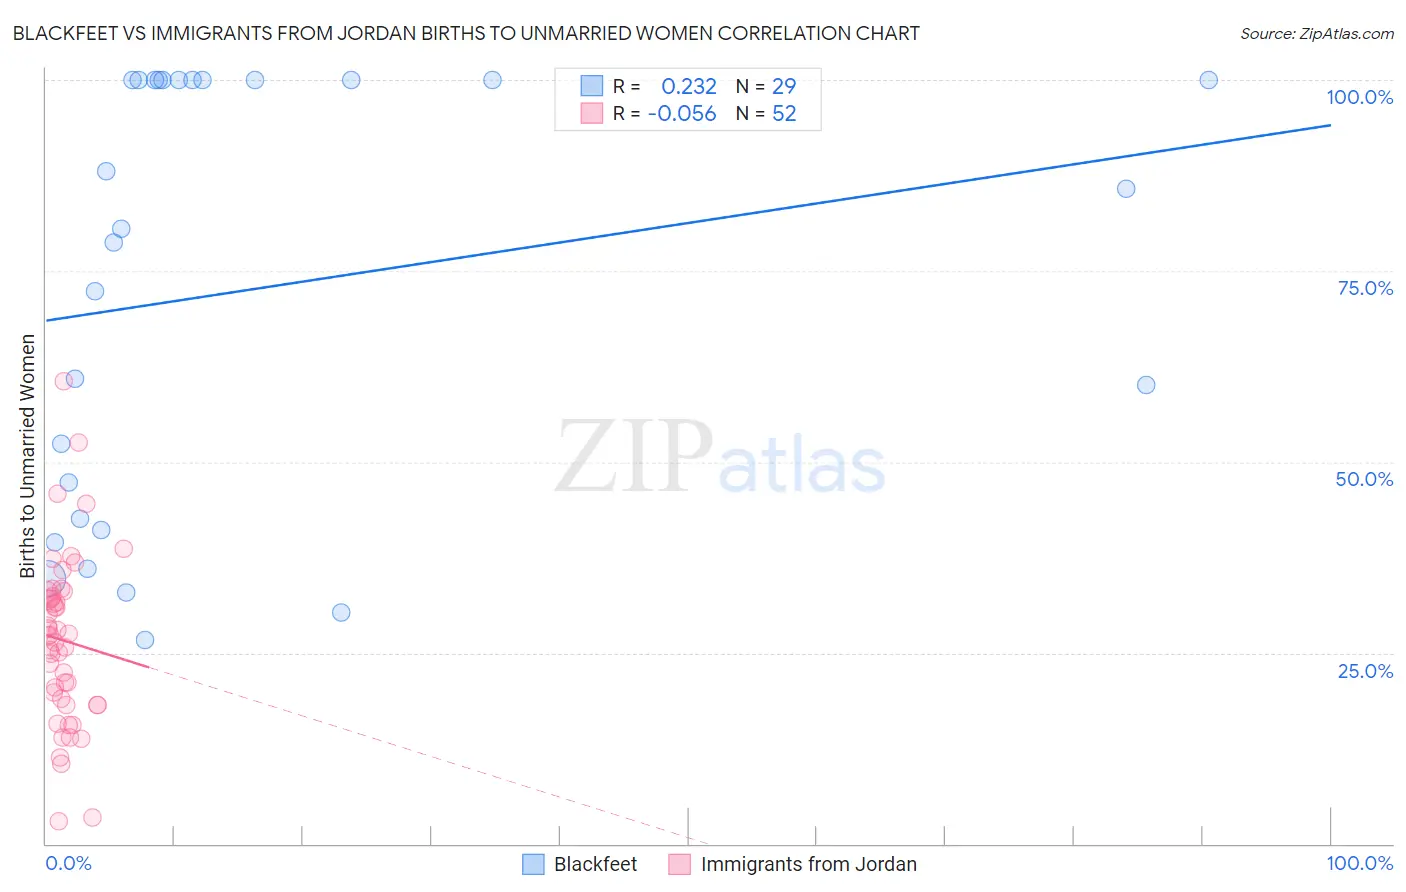
Blackfeet vs Immigrants from Jordan Births to Unmarried Women Correlation Chart
The statistical analysis conducted on geographies consisting of 296,921,104 people shows a weak positive correlation between the proportion of Blackfeet and percentage of births to unmarried women in the United States with a correlation coefficient (R) of 0.232 and weighted average of 37.9%. Similarly, the statistical analysis conducted on geographies consisting of 174,993,428 people shows a slight negative correlation between the proportion of Immigrants from Jordan and percentage of births to unmarried women in the United States with a correlation coefficient (R) of -0.056 and weighted average of 29.0%, a difference of 30.9%.
Births to Unmarried Women Correlation Summary
| Measurement | Blackfeet | Immigrants from Jordan |
| Minimum | 26.7% | 2.9% |
| Maximum | 100.0% | 60.6% |
| Range | 73.3% | 57.7% |
| Mean | 72.7% | 26.6% |
| Median | 80.5% | 27.3% |
| Interquartile 25% (IQ1) | 41.8% | 18.5% |
| Interquartile 75% (IQ3) | 100.0% | 32.6% |
| Interquartile Range (IQR) | 58.2% | 14.1% |
| Standard Deviation (Sample) | 28.1% | 11.2% |
| Standard Deviation (Population) | 27.6% | 11.1% |
Similar Demographics by Births to Unmarried Women
Demographics Similar to Blackfeet by Births to Unmarried Women
In terms of births to unmarried women, the demographic groups most similar to Blackfeet are Seminole (37.9%, a difference of 0.050%), Immigrants from Nicaragua (38.0%, a difference of 0.15%), British West Indian (38.0%, a difference of 0.20%), Hispanic or Latino (37.8%, a difference of 0.39%), and Alaskan Athabascan (37.7%, a difference of 0.52%).
| Demographics | Rating | Rank | Births to Unmarried Women |
| Immigrants | Mexico | 0.0 /100 | #285 | Tragic 37.5% |
| Immigrants | Guatemala | 0.0 /100 | #286 | Tragic 37.5% |
| Creek | 0.0 /100 | #287 | Tragic 37.6% |
| Immigrants | Liberia | 0.0 /100 | #288 | Tragic 37.6% |
| Alaskan Athabascans | 0.0 /100 | #289 | Tragic 37.7% |
| Hispanics or Latinos | 0.0 /100 | #290 | Tragic 37.8% |
| Seminole | 0.0 /100 | #291 | Tragic 37.9% |
| Blackfeet | 0.0 /100 | #292 | Tragic 37.9% |
| Immigrants | Nicaragua | 0.0 /100 | #293 | Tragic 38.0% |
| British West Indians | 0.0 /100 | #294 | Tragic 38.0% |
| Iroquois | 0.0 /100 | #295 | Tragic 38.2% |
| Alaska Natives | 0.0 /100 | #296 | Tragic 38.3% |
| Dutch West Indians | 0.0 /100 | #297 | Tragic 38.4% |
| Jamaicans | 0.0 /100 | #298 | Tragic 38.5% |
| Spanish Americans | 0.0 /100 | #299 | Tragic 38.6% |
Demographics Similar to Immigrants from Jordan by Births to Unmarried Women
In terms of births to unmarried women, the demographic groups most similar to Immigrants from Jordan are Sri Lankan (28.9%, a difference of 0.070%), Taiwanese (29.0%, a difference of 0.070%), Immigrants from France (29.0%, a difference of 0.080%), Immigrants from Poland (28.9%, a difference of 0.24%), and Immigrants from Saudi Arabia (29.1%, a difference of 0.36%).
| Demographics | Rating | Rank | Births to Unmarried Women |
| Danes | 98.2 /100 | #79 | Exceptional 28.7% |
| Immigrants | Afghanistan | 98.1 /100 | #80 | Exceptional 28.7% |
| Immigrants | Austria | 98.1 /100 | #81 | Exceptional 28.7% |
| Romanians | 98.0 /100 | #82 | Exceptional 28.7% |
| Immigrants | Kuwait | 98.0 /100 | #83 | Exceptional 28.8% |
| Immigrants | Poland | 97.6 /100 | #84 | Exceptional 28.9% |
| Sri Lankans | 97.5 /100 | #85 | Exceptional 28.9% |
| Immigrants | Jordan | 97.4 /100 | #86 | Exceptional 29.0% |
| Taiwanese | 97.3 /100 | #87 | Exceptional 29.0% |
| Immigrants | France | 97.3 /100 | #88 | Exceptional 29.0% |
| Immigrants | Saudi Arabia | 97.0 /100 | #89 | Exceptional 29.1% |
| Immigrants | Latvia | 96.8 /100 | #90 | Exceptional 29.1% |
| Immigrants | Fiji | 96.6 /100 | #91 | Exceptional 29.2% |
| Arabs | 96.5 /100 | #92 | Exceptional 29.2% |
| Estonians | 96.5 /100 | #93 | Exceptional 29.2% |