Bhutanese vs Belgian Single Mother Households

COMPARE

Bhutanese
Race
Ancestry
AfghanAfricanAlaska NativeAlaskan AthabascanAlbanianAleutAlsatianAmericanApacheArabArapahoArgentineanArmenianAssyrian/Chaldean/SyriacAustralianAustrianBahamianBangladeshiBarbadianBasqueBelizeanBermudanBhutaneseBlackfeetBolivianBrazilianBritishBritish West IndianBulgarianBurmeseCajunCambodianCanadianCape VerdeanCarpatho RusynCelticCentral AmericanCentral American IndianCherokeeCheyenneChickasawChileanChineseChippewaChoctawColombianColvilleComancheCosta RicanCreeCreekCroatianCrowCubanCypriotCzechCzechoslovakianDanishDelawareDominicanDutchDutch West IndianEastern EuropeanEcuadorianEgyptianEnglishEstonianEthiopianEuropeanFijianFilipinoFinnishFrenchFrench American IndianFrench CanadianGermanGerman RussianGhanaianGreekGuamanian/ChamorroGuatemalanGuyaneseHaitianHmongHonduranHopiHoumaHungarianIcelanderIndian (Asian)IndonesianInupiatIranianIraqiIrishIroquoisIsraeliItalianJamaicanJapaneseJordanianKenyanKiowaKoreanLaotianLatvianLebaneseLiberianLithuanianLumbeeLuxembourgerMacedonianMalaysianMalteseMarshalleseMenomineeMexicanMexican American IndianMongolianMoroccanNative HawaiianNavajoNepaleseNew ZealanderNicaraguanNigerianNorthern EuropeanNorwegianOkinawanOsageOttawaPaiutePakistaniPalestinianPanamanianParaguayanPennsylvania GermanPeruvianPimaPolishPortuguesePotawatomiPuebloPuerto RicanPuget Sound SalishRomanianRussianSalvadoranSamoanScandinavianScotch-IrishScottishSeminoleSenegaleseSerbianShoshoneSierra LeoneanSiouxSlavicSlovakSloveneSomaliSouth AfricanSouth AmericanSouth American IndianSoviet UnionSpaniardSpanishSpanish AmericanSpanish American IndianSri LankanSubsaharan AfricanSudaneseSwedishSwissSyrianTaiwaneseThaiTlingit-HaidaTohono O'OdhamTonganTrinidadian and TobagonianTsimshianTurkishU.S. Virgin IslanderUgandanUkrainianUruguayanUteVenezuelanVietnameseWelshWest IndianYakamaYaquiYugoslavianYumanYup'ikZimbabwean
Immigration
NonimmigrantsImmigrantsAfghanistanAfricaAlbaniaArgentinaArmeniaAsiaAustraliaAustriaBahamasBangladeshBarbadosBelarusBelgiumBelizeBoliviaBosnia and HerzegovinaBrazilBulgariaBurma/MyanmarCabo VerdeCambodiaCameroonCanadaCaribbeanCentral AmericaChileChinaColombiaCongoCosta RicaCroatiaCubaCzechoslovakiaDenmarkDominicaDominican RepublicEastern AfricaEastern AsiaEastern EuropeEcuadorEgyptEl SalvadorEnglandEritreaEthiopiaEuropeFijiFranceGermanyGhanaGreeceGrenadaGuatemalaGuyanaHaitiHondurasHong KongHungaryIndiaIndonesiaIranIraqIrelandIsraelItalyJamaicaJapanJordanKazakhstanKenyaKoreaKuwaitLaosLatin AmericaLatviaLebanonLiberiaLithuaniaMalaysiaMexicoMicronesiaMiddle AfricaMoldovaMoroccoNepalNetherlandsNicaraguaNigeriaNorth AmericaNorth MacedoniaNorthern AfricaNorthern EuropeNorwayOceaniaPakistanPanamaPeruPhilippinesPolandPortugalRomaniaRussiaSaudi ArabiaScotlandSenegalSerbiaSierra LeoneSingaporeSomaliaSouth AfricaSouth AmericaSouth Central AsiaSouth Eastern AsiaSouthern EuropeSpainSri LankaSt. Vincent and the GrenadinesSudanSwedenSwitzerlandSyriaTaiwanThailandTrinidad and TobagoTurkeyUgandaUkraineUruguayUzbekistanVenezuelaVietnamWest IndiesWestern AfricaWestern AsiaWestern EuropeYemenZaireZimbabweAzores
Belgian
Race
Ancestry
AfghanAfricanAlaska NativeAlaskan AthabascanAlbanianAleutAlsatianAmericanApacheArabArapahoArgentineanArmenianAssyrian/Chaldean/SyriacAustralianAustrianBahamianBangladeshiBarbadianBasqueBelgianBelizeanBermudanBlackfeetBolivianBrazilianBritishBritish West IndianBulgarianBurmeseCajunCambodianCanadianCape VerdeanCarpatho RusynCelticCentral AmericanCentral American IndianCherokeeCheyenneChickasawChileanChineseChippewaChoctawColombianColvilleComancheCosta RicanCreeCreekCroatianCrowCubanCypriotCzechCzechoslovakianDanishDelawareDominicanDutchDutch West IndianEastern EuropeanEcuadorianEgyptianEnglishEstonianEthiopianEuropeanFijianFilipinoFinnishFrenchFrench American IndianFrench CanadianGermanGerman RussianGhanaianGreekGuamanian/ChamorroGuatemalanGuyaneseHaitianHmongHonduranHopiHoumaHungarianIcelanderIndian (Asian)IndonesianInupiatIranianIraqiIrishIroquoisIsraeliItalianJamaicanJapaneseJordanianKenyanKiowaKoreanLaotianLatvianLebaneseLiberianLithuanianLumbeeLuxembourgerMacedonianMalaysianMalteseMarshalleseMenomineeMexicanMexican American IndianMongolianMoroccanNative HawaiianNavajoNepaleseNew ZealanderNicaraguanNigerianNorthern EuropeanNorwegianOkinawanOsageOttawaPaiutePakistaniPalestinianPanamanianParaguayanPennsylvania GermanPeruvianPimaPolishPortuguesePotawatomiPuebloPuerto RicanPuget Sound SalishRomanianRussianSalvadoranSamoanScandinavianScotch-IrishScottishSeminoleSenegaleseSerbianShoshoneSierra LeoneanSiouxSlavicSlovakSloveneSomaliSouth AfricanSouth AmericanSouth American IndianSoviet UnionSpaniardSpanishSpanish AmericanSpanish American IndianSri LankanSubsaharan AfricanSudaneseSwedishSwissSyrianTaiwaneseThaiTlingit-HaidaTohono O'OdhamTonganTrinidadian and TobagonianTsimshianTurkishU.S. Virgin IslanderUgandanUkrainianUruguayanUteVenezuelanVietnameseWelshWest IndianYakamaYaquiYugoslavianYumanYup'ikZimbabwean
Immigration
NonimmigrantsImmigrantsAfghanistanAfricaAlbaniaArgentinaArmeniaAsiaAustraliaAustriaBahamasBangladeshBarbadosBelarusBelgiumBelizeBoliviaBosnia and HerzegovinaBrazilBulgariaBurma/MyanmarCabo VerdeCambodiaCameroonCanadaCaribbeanCentral AmericaChileChinaColombiaCongoCosta RicaCroatiaCubaCzechoslovakiaDenmarkDominicaDominican RepublicEastern AfricaEastern AsiaEastern EuropeEcuadorEgyptEl SalvadorEnglandEritreaEthiopiaEuropeFijiFranceGermanyGhanaGreeceGrenadaGuatemalaGuyanaHaitiHondurasHong KongHungaryIndiaIndonesiaIranIraqIrelandIsraelItalyJamaicaJapanJordanKazakhstanKenyaKoreaKuwaitLaosLatin AmericaLatviaLebanonLiberiaLithuaniaMalaysiaMexicoMicronesiaMiddle AfricaMoldovaMoroccoNepalNetherlandsNicaraguaNigeriaNorth AmericaNorth MacedoniaNorthern AfricaNorthern EuropeNorwayOceaniaPakistanPanamaPeruPhilippinesPolandPortugalRomaniaRussiaSaudi ArabiaScotlandSenegalSerbiaSierra LeoneSingaporeSomaliaSouth AfricaSouth AmericaSouth Central AsiaSouth Eastern AsiaSouthern EuropeSpainSri LankaSt. Vincent and the GrenadinesSudanSwedenSwitzerlandSyriaTaiwanThailandTrinidad and TobagoTurkeyUgandaUkraineUruguayUzbekistanVenezuelaVietnamWest IndiesWestern AfricaWestern AsiaWestern EuropeYemenZaireZimbabweAzores
Single Mother Households
Income
Poverty
Unemployment
Labor Participation
Family Structure
Vehicle Availability
Education Level
Disability

Single Mother Households Comparison

Bhutanese

Belgians

Exceptional
Exceptional
5.3%
SINGLE MOTHER HOUSEHOLDS
99.7/ 100
METRIC RATING
27th/ 347
METRIC RANK
5.8%
SINGLE MOTHER HOUSEHOLDS
93.5/ 100
METRIC RATING
122nd/ 347
METRIC RANK

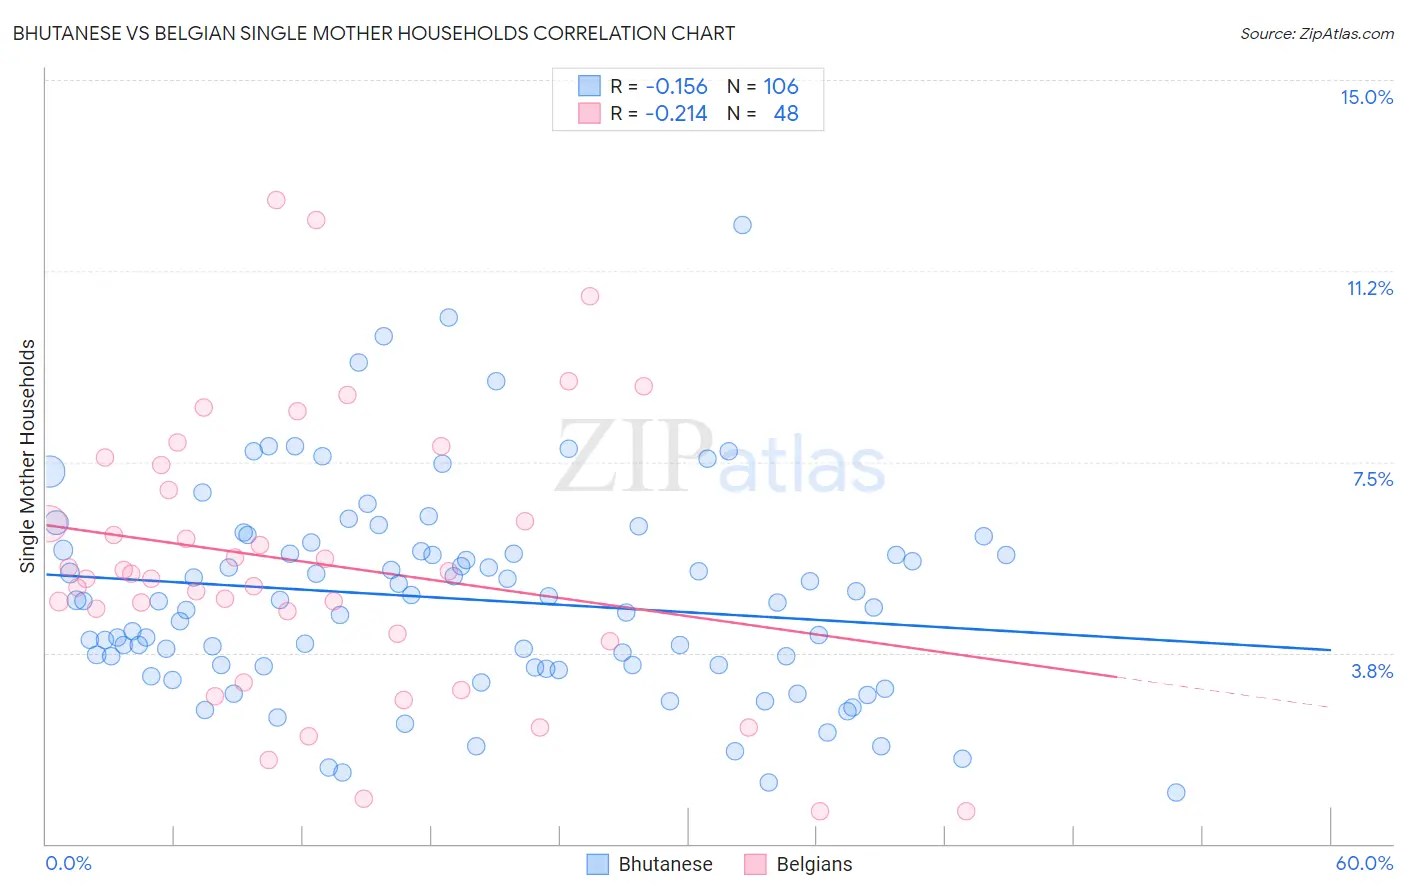
Bhutanese vs Belgian Single Mother Households Correlation Chart

The statistical analysis conducted on geographies consisting of 453,820,628 people shows a poor negative correlation between the proportion of Bhutanese and percentage of single mother households in the United States with a correlation coefficient (R) of -0.156 and weighted average of 5.3%. Similarly, the statistical analysis conducted on geographies consisting of 354,851,895 people shows a weak negative correlation between the proportion of Belgians and percentage of single mother households in the United States with a correlation coefficient (R) of -0.214 and weighted average of 5.8%, a difference of 10.8%.
Bhutanese vs Belgian Single Mother Households

Single Mother Households Correlation Summary

MeasurementBhutaneseBelgian
Minimum1.0%0.64%
Maximum12.1%12.7%
Range11.1%12.0%
Mean4.8%5.5%
Median4.8%5.3%
Interquartile 25% (IQ1)3.5%4.0%
Interquartile 75% (IQ3)5.7%7.2%
Interquartile Range (IQR)2.3%3.2%
Standard Deviation (Sample)2.0%2.7%
Standard Deviation (Population)2.0%2.7%

Similar Demographics by Single Mother Households

Demographics Similar to Bhutanese by Single Mother Households

In terms of single mother households, the demographic groups most similar to Bhutanese are Russian (5.3%, a difference of 0.10%), Latvian (5.3%, a difference of 0.12%), Burmese (5.3%, a difference of 0.18%), Immigrants from Korea (5.3%, a difference of 0.18%), and Cambodian (5.3%, a difference of 0.19%).
DemographicsRating | RankSingle Mother Households
Maltese
99.9
/100
|
#20
Exceptional
5.2%
Eastern Europeans
99.8
/100
|
#21
Exceptional
5.2%
Thais
99.8
/100
|
#22
Exceptional
5.2%
Immigrants | Austria
99.8
/100
|
#23
Exceptional
5.2%
Armenians
99.8
/100
|
#24
Exceptional
5.2%
Immigrants | Japan
99.8
/100
|
#25
Exceptional
5.2%
Immigrants | Lithuania
99.8
/100
|
#26
Exceptional
5.3%
Bhutanese
99.7
/100
|
#27
Exceptional
5.3%
Russians
99.7
/100
|
#28
Exceptional
5.3%
Latvians
99.7
/100
|
#29
Exceptional
5.3%
Burmese
99.7
/100
|
#30
Exceptional
5.3%
Immigrants | Korea
99.7
/100
|
#31
Exceptional
5.3%
Cambodians
99.7
/100
|
#32
Exceptional
5.3%
Immigrants | Switzerland
99.7
/100
|
#33
Exceptional
5.3%
Bulgarians
99.7
/100
|
#34
Exceptional
5.3%

Demographics Similar to Belgians by Single Mother Households

In terms of single mother households, the demographic groups most similar to Belgians are Immigrants from Uzbekistan (5.9%, a difference of 0.060%), Argentinean (5.8%, a difference of 0.080%), Tongan (5.8%, a difference of 0.10%), Immigrants from Argentina (5.9%, a difference of 0.13%), and Slavic (5.9%, a difference of 0.29%).
DemographicsRating | RankSingle Mother Households
Irish
94.8
/100
|
#115
Exceptional
5.8%
Pennsylvania Germans
94.7
/100
|
#116
Exceptional
5.8%
Bolivians
94.6
/100
|
#117
Exceptional
5.8%
Laotians
94.3
/100
|
#118
Exceptional
5.8%
South Africans
94.1
/100
|
#119
Exceptional
5.8%
Tongans
93.7
/100
|
#120
Exceptional
5.8%
Argentineans
93.7
/100
|
#121
Exceptional
5.8%
Belgians
93.5
/100
|
#122
Exceptional
5.8%
Immigrants | Uzbekistan
93.4
/100
|
#123
Exceptional
5.9%
Immigrants | Argentina
93.2
/100
|
#124
Exceptional
5.9%
Slavs
92.9
/100
|
#125
Exceptional
5.9%
Welsh
92.8
/100
|
#126
Exceptional
5.9%
Lebanese
92.4
/100
|
#127
Exceptional
5.9%
Czechoslovakians
92.2
/100
|
#128
Exceptional
5.9%
Immigrants | Bolivia
92.2
/100
|
#129
Exceptional
5.9%