Bermudan vs Immigrants from Sudan Average Family Size
COMPARE
Bermudan
Immigrants from Sudan
Average Family Size
Average Family Size Comparison
Bermudans
Immigrants from Sudan
3.20
AVERAGE FAMILY SIZE
11.0/ 100
METRIC RATING
216th/ 347
METRIC RANK
3.22
AVERAGE FAMILY SIZE
29.1/ 100
METRIC RATING
194th/ 347
METRIC RANK
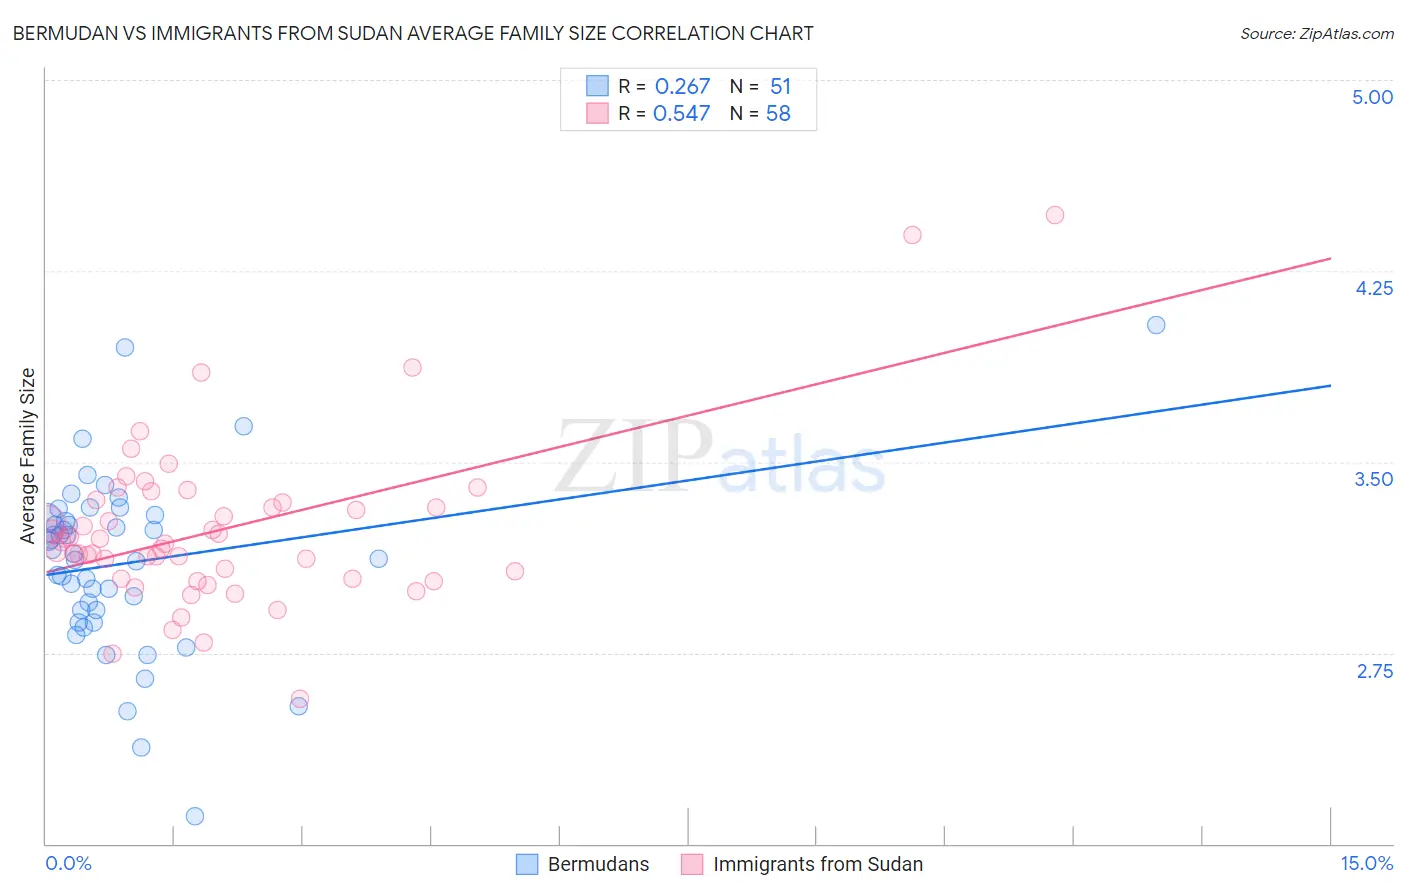
Bermudan vs Immigrants from Sudan Average Family Size Correlation Chart
The statistical analysis conducted on geographies consisting of 55,716,155 people shows a weak positive correlation between the proportion of Bermudans and average family size in the United States with a correlation coefficient (R) of 0.267 and weighted average of 3.20. Similarly, the statistical analysis conducted on geographies consisting of 118,946,972 people shows a substantial positive correlation between the proportion of Immigrants from Sudan and average family size in the United States with a correlation coefficient (R) of 0.547 and weighted average of 3.22, a difference of 0.55%.
Average Family Size Correlation Summary
| Measurement | Bermudan | Immigrants from Sudan |
| Minimum | 2.11 | 2.57 |
| Maximum | 4.04 | 4.47 |
| Range | 1.93 | 1.90 |
| Mean | 3.10 | 3.23 |
| Median | 3.14 | 3.18 |
| Interquartile 25% (IQ1) | 2.92 | 3.04 |
| Interquartile 75% (IQ3) | 3.28 | 3.34 |
| Interquartile Range (IQR) | 0.36 | 0.30 |
| Standard Deviation (Sample) | 0.35 | 0.33 |
| Standard Deviation (Population) | 0.34 | 0.32 |
Similar Demographics by Average Family Size
Demographics Similar to Bermudans by Average Family Size
In terms of average family size, the demographic groups most similar to Bermudans are Delaware (3.20, a difference of 0.0%), Somali (3.20, a difference of 0.010%), Mongolian (3.20, a difference of 0.030%), Immigrants from Somalia (3.20, a difference of 0.030%), and Immigrants from Iran (3.20, a difference of 0.050%).
| Demographics | Rating | Rank | Average Family Size |
| Sudanese | 13.3 /100 | #209 | Poor 3.20 |
| Zimbabweans | 12.6 /100 | #210 | Poor 3.20 |
| Immigrants | Iran | 12.1 /100 | #211 | Poor 3.20 |
| Creek | 12.1 /100 | #212 | Poor 3.20 |
| Mongolians | 11.5 /100 | #213 | Poor 3.20 |
| Somalis | 11.2 /100 | #214 | Poor 3.20 |
| Delaware | 11.1 /100 | #215 | Poor 3.20 |
| Bermudans | 11.0 /100 | #216 | Poor 3.20 |
| Immigrants | Somalia | 10.3 /100 | #217 | Poor 3.20 |
| French American Indians | 9.8 /100 | #218 | Tragic 3.20 |
| Pennsylvania Germans | 9.3 /100 | #219 | Tragic 3.19 |
| Lebanese | 9.1 /100 | #220 | Tragic 3.19 |
| Immigrants | Ukraine | 7.2 /100 | #221 | Tragic 3.19 |
| Immigrants | Kuwait | 7.2 /100 | #222 | Tragic 3.19 |
| Immigrants | Zimbabwe | 7.1 /100 | #223 | Tragic 3.19 |
Demographics Similar to Immigrants from Sudan by Average Family Size
In terms of average family size, the demographic groups most similar to Immigrants from Sudan are Immigrants from Israel (3.22, a difference of 0.0%), Immigrants from Eastern Africa (3.22, a difference of 0.020%), Choctaw (3.21, a difference of 0.020%), Senegalese (3.21, a difference of 0.020%), and Kenyan (3.21, a difference of 0.020%).
| Demographics | Rating | Rank | Average Family Size |
| Immigrants | Malaysia | 39.0 /100 | #187 | Fair 3.22 |
| Thais | 38.3 /100 | #188 | Fair 3.22 |
| Pakistanis | 33.7 /100 | #189 | Fair 3.22 |
| Burmese | 31.0 /100 | #190 | Fair 3.22 |
| Immigrants | Zaire | 30.5 /100 | #191 | Fair 3.22 |
| Immigrants | Eastern Africa | 30.1 /100 | #192 | Fair 3.22 |
| Immigrants | Israel | 29.3 /100 | #193 | Fair 3.22 |
| Immigrants | Sudan | 29.1 /100 | #194 | Fair 3.22 |
| Choctaw | 28.3 /100 | #195 | Fair 3.21 |
| Senegalese | 28.2 /100 | #196 | Fair 3.21 |
| Kenyans | 28.0 /100 | #197 | Fair 3.21 |
| Immigrants | Azores | 21.7 /100 | #198 | Fair 3.21 |
| Hmong | 20.7 /100 | #199 | Fair 3.21 |
| Immigrants | Kenya | 19.2 /100 | #200 | Poor 3.21 |
| Immigrants | Morocco | 18.5 /100 | #201 | Poor 3.21 |