Basque vs Armenian Single Father Households
COMPARE
Basque
Armenian
Single Father Households
Single Father Households Comparison
Basques
Armenians
2.5%
SINGLE FATHER HOUSEHOLDS
2.5/ 100
METRIC RATING
245th/ 347
METRIC RANK
2.1%
SINGLE FATHER HOUSEHOLDS
99.7/ 100
METRIC RATING
81st/ 347
METRIC RANK
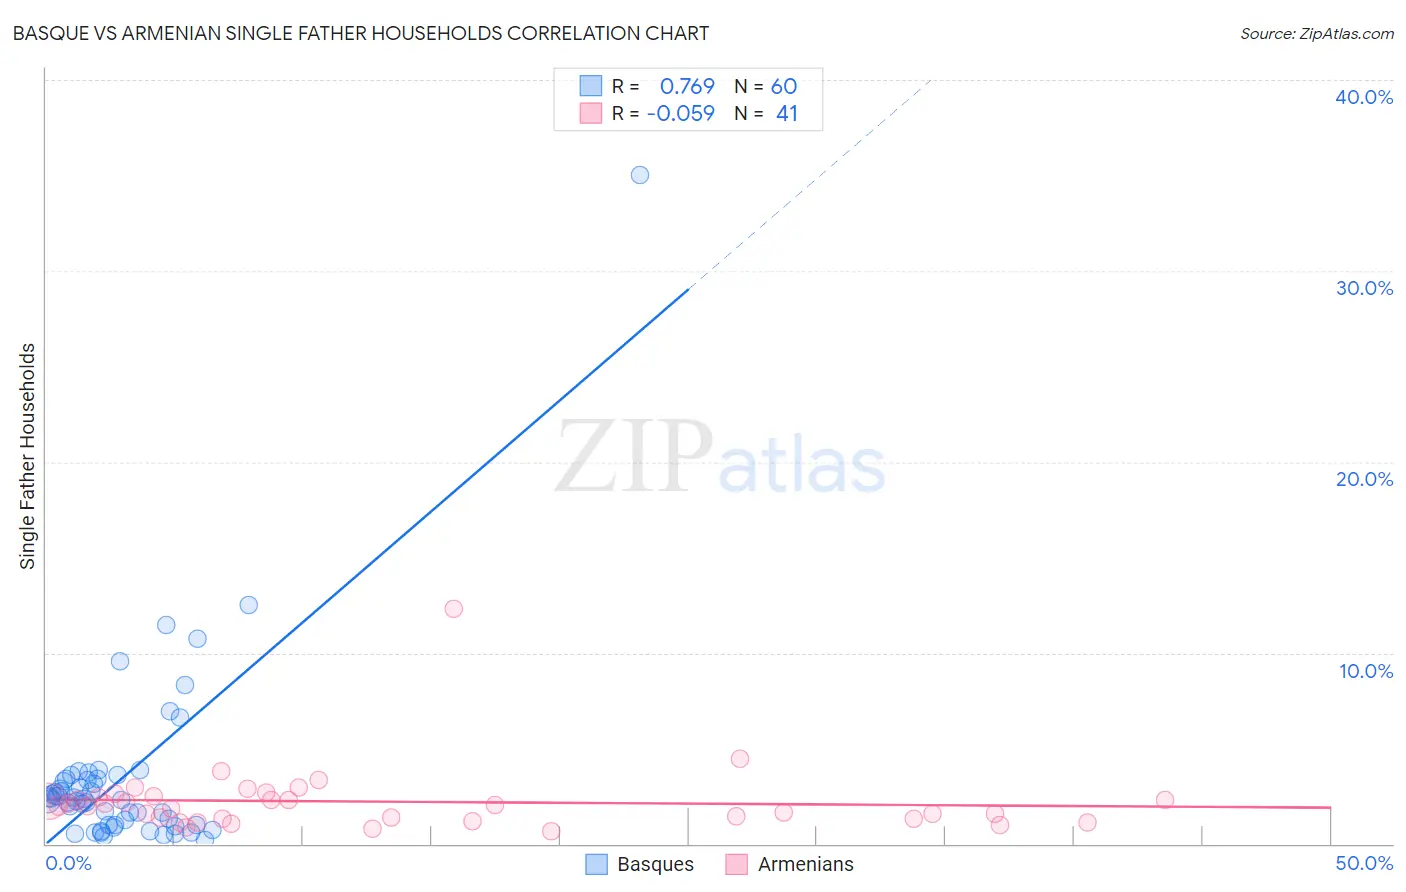
Basque vs Armenian Single Father Households Correlation Chart
The statistical analysis conducted on geographies consisting of 165,235,183 people shows a strong positive correlation between the proportion of Basques and percentage of single father households in the United States with a correlation coefficient (R) of 0.769 and weighted average of 2.5%. Similarly, the statistical analysis conducted on geographies consisting of 308,570,699 people shows a slight negative correlation between the proportion of Armenians and percentage of single father households in the United States with a correlation coefficient (R) of -0.059 and weighted average of 2.1%, a difference of 19.4%.
Single Father Households Correlation Summary
| Measurement | Basque | Armenian |
| Minimum | 0.20% | 0.66% |
| Maximum | 35.0% | 12.3% |
| Range | 34.8% | 11.7% |
| Mean | 3.4% | 2.2% |
| Median | 2.4% | 2.0% |
| Interquartile 25% (IQ1) | 0.99% | 1.3% |
| Interquartile 75% (IQ3) | 3.4% | 2.5% |
| Interquartile Range (IQR) | 2.4% | 1.1% |
| Standard Deviation (Sample) | 5.0% | 1.8% |
| Standard Deviation (Population) | 4.9% | 1.8% |
Similar Demographics by Single Father Households
Demographics Similar to Basques by Single Father Households
In terms of single father households, the demographic groups most similar to Basques are Native Hawaiian (2.5%, a difference of 0.020%), Delaware (2.5%, a difference of 0.030%), Bahamian (2.5%, a difference of 0.080%), Immigrants from Cameroon (2.5%, a difference of 0.16%), and Immigrants from Middle Africa (2.5%, a difference of 0.21%).
| Demographics | Rating | Rank | Single Father Households |
| Immigrants | Sierra Leone | 5.8 /100 | #238 | Tragic 2.5% |
| Immigrants | Oceania | 5.8 /100 | #239 | Tragic 2.5% |
| Immigrants | Dominica | 4.8 /100 | #240 | Tragic 2.5% |
| Portuguese | 4.1 /100 | #241 | Tragic 2.5% |
| Osage | 4.1 /100 | #242 | Tragic 2.5% |
| Spaniards | 3.1 /100 | #243 | Tragic 2.5% |
| Immigrants | Middle Africa | 2.8 /100 | #244 | Tragic 2.5% |
| Basques | 2.5 /100 | #245 | Tragic 2.5% |
| Native Hawaiians | 2.5 /100 | #246 | Tragic 2.5% |
| Delaware | 2.5 /100 | #247 | Tragic 2.5% |
| Bahamians | 2.4 /100 | #248 | Tragic 2.5% |
| Immigrants | Cameroon | 2.3 /100 | #249 | Tragic 2.5% |
| Somalis | 2.1 /100 | #250 | Tragic 2.5% |
| Liberians | 2.0 /100 | #251 | Tragic 2.5% |
| Immigrants | Eritrea | 2.0 /100 | #252 | Tragic 2.5% |
Demographics Similar to Armenians by Single Father Households
In terms of single father households, the demographic groups most similar to Armenians are New Zealander (2.1%, a difference of 0.050%), Greek (2.1%, a difference of 0.060%), Immigrants from South Africa (2.1%, a difference of 0.080%), Immigrants from Asia (2.1%, a difference of 0.17%), and Estonian (2.1%, a difference of 0.28%).
| Demographics | Rating | Rank | Single Father Households |
| Immigrants | Egypt | 99.8 /100 | #74 | Exceptional 2.1% |
| Immigrants | Sweden | 99.8 /100 | #75 | Exceptional 2.1% |
| Immigrants | Scotland | 99.8 /100 | #76 | Exceptional 2.1% |
| Immigrants | Saudi Arabia | 99.8 /100 | #77 | Exceptional 2.1% |
| Estonians | 99.7 /100 | #78 | Exceptional 2.1% |
| Immigrants | Asia | 99.7 /100 | #79 | Exceptional 2.1% |
| Immigrants | South Africa | 99.7 /100 | #80 | Exceptional 2.1% |
| Armenians | 99.7 /100 | #81 | Exceptional 2.1% |
| New Zealanders | 99.7 /100 | #82 | Exceptional 2.1% |
| Greeks | 99.7 /100 | #83 | Exceptional 2.1% |
| Carpatho Rusyns | 99.6 /100 | #84 | Exceptional 2.1% |
| Immigrants | Hungary | 99.6 /100 | #85 | Exceptional 2.1% |
| Asians | 99.6 /100 | #86 | Exceptional 2.1% |
| Lithuanians | 99.5 /100 | #87 | Exceptional 2.1% |
| Bhutanese | 99.5 /100 | #88 | Exceptional 2.1% |