Bangladeshi vs U.S. Virgin Islander Single Mother Households
COMPARE
Bangladeshi
U.S. Virgin Islander
Single Mother Households
Single Mother Households Comparison
Bangladeshis
U.S. Virgin Islanders
8.1%
SINGLE MOTHER HOUSEHOLDS
0.0/ 100
METRIC RATING
312th/ 347
METRIC RANK
8.6%
SINGLE MOTHER HOUSEHOLDS
0.0/ 100
METRIC RATING
332nd/ 347
METRIC RANK
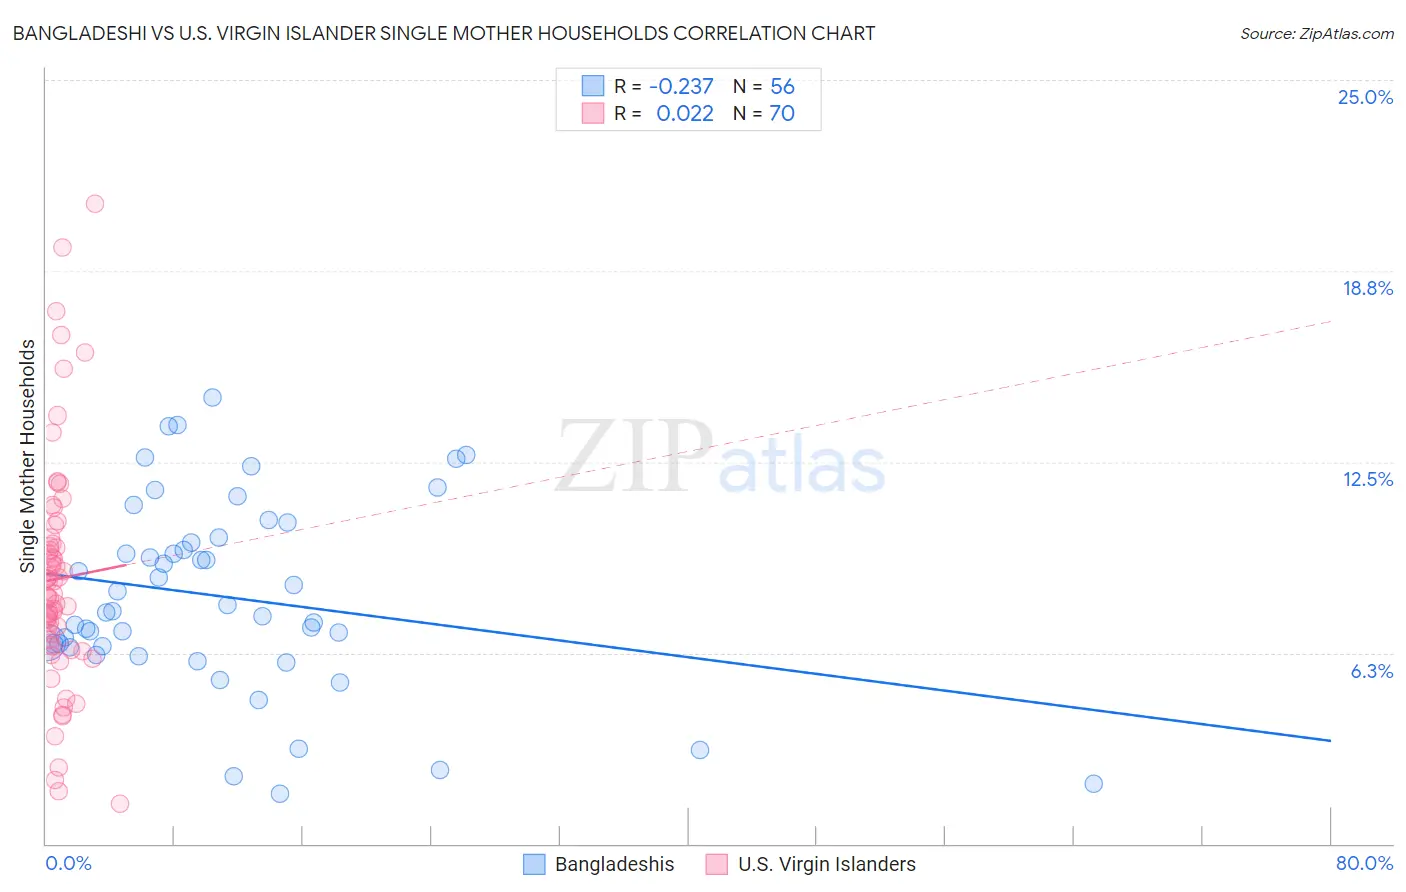
Bangladeshi vs U.S. Virgin Islander Single Mother Households Correlation Chart
The statistical analysis conducted on geographies consisting of 141,271,331 people shows a weak negative correlation between the proportion of Bangladeshis and percentage of single mother households in the United States with a correlation coefficient (R) of -0.237 and weighted average of 8.1%. Similarly, the statistical analysis conducted on geographies consisting of 87,484,063 people shows no correlation between the proportion of U.S. Virgin Islanders and percentage of single mother households in the United States with a correlation coefficient (R) of 0.022 and weighted average of 8.6%, a difference of 5.8%.
Single Mother Households Correlation Summary
| Measurement | Bangladeshi | U.S. Virgin Islander |
| Minimum | 1.7% | 1.3% |
| Maximum | 14.6% | 21.0% |
| Range | 13.0% | 19.7% |
| Mean | 8.1% | 8.7% |
| Median | 7.6% | 8.1% |
| Interquartile 25% (IQ1) | 6.4% | 6.5% |
| Interquartile 75% (IQ3) | 9.9% | 9.8% |
| Interquartile Range (IQR) | 3.5% | 3.3% |
| Standard Deviation (Sample) | 3.1% | 3.8% |
| Standard Deviation (Population) | 3.1% | 3.8% |
Demographics Similar to Bangladeshis and U.S. Virgin Islanders by Single Mother Households
In terms of single mother households, the demographic groups most similar to Bangladeshis are Immigrants from Grenada (8.2%, a difference of 0.16%), Immigrants from Mexico (8.2%, a difference of 0.28%), Immigrants from Western Africa (8.2%, a difference of 0.31%), African (8.2%, a difference of 0.46%), and Immigrants from Honduras (8.2%, a difference of 0.59%). Similarly, the demographic groups most similar to U.S. Virgin Islanders are Inupiat (8.5%, a difference of 1.5%), Sioux (8.5%, a difference of 1.5%), Hopi (8.5%, a difference of 1.6%), Yakama (8.4%, a difference of 2.4%), and Immigrants from Haiti (8.4%, a difference of 2.6%).
| Demographics | Rating | Rank | Single Mother Households |
| Bangladeshis | 0.0 /100 | #312 | Tragic 8.1% |
| Immigrants | Grenada | 0.0 /100 | #313 | Tragic 8.2% |
| Immigrants | Mexico | 0.0 /100 | #314 | Tragic 8.2% |
| Immigrants | Western Africa | 0.0 /100 | #315 | Tragic 8.2% |
| Africans | 0.0 /100 | #316 | Tragic 8.2% |
| Immigrants | Honduras | 0.0 /100 | #317 | Tragic 8.2% |
| Senegalese | 0.0 /100 | #318 | Tragic 8.2% |
| Jamaicans | 0.0 /100 | #319 | Tragic 8.2% |
| Bahamians | 0.0 /100 | #320 | Tragic 8.3% |
| Immigrants | Senegal | 0.0 /100 | #321 | Tragic 8.3% |
| Pima | 0.0 /100 | #322 | Tragic 8.3% |
| Haitians | 0.0 /100 | #323 | Tragic 8.3% |
| Immigrants | Jamaica | 0.0 /100 | #324 | Tragic 8.4% |
| Immigrants | Caribbean | 0.0 /100 | #325 | Tragic 8.4% |
| British West Indians | 0.0 /100 | #326 | Tragic 8.4% |
| Immigrants | Haiti | 0.0 /100 | #327 | Tragic 8.4% |
| Yakama | 0.0 /100 | #328 | Tragic 8.4% |
| Hopi | 0.0 /100 | #329 | Tragic 8.5% |
| Inupiat | 0.0 /100 | #330 | Tragic 8.5% |
| Sioux | 0.0 /100 | #331 | Tragic 8.5% |
| U.S. Virgin Islanders | 0.0 /100 | #332 | Tragic 8.6% |