Bangladeshi vs Polish Births to Unmarried Women
COMPARE
Bangladeshi
Polish
Births to Unmarried Women
Births to Unmarried Women Comparison
Bangladeshis
Poles
34.4%
BIRTHS TO UNMARRIED WOMEN
2.5/ 100
METRIC RATING
233rd/ 347
METRIC RANK
30.8%
BIRTHS TO UNMARRIED WOMEN
76.2/ 100
METRIC RATING
152nd/ 347
METRIC RANK
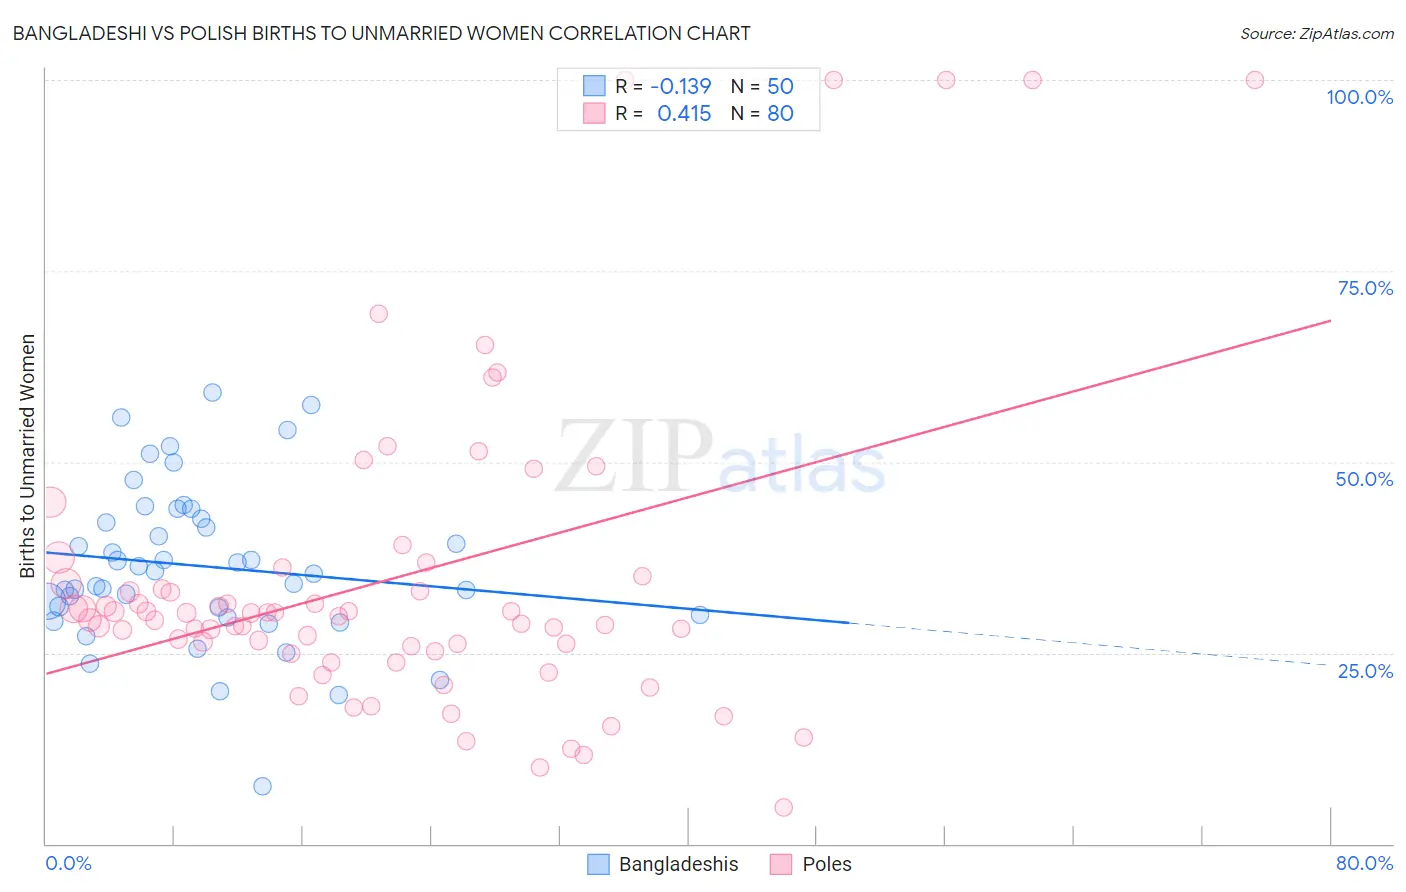
Bangladeshi vs Polish Births to Unmarried Women Correlation Chart
The statistical analysis conducted on geographies consisting of 137,729,923 people shows a poor negative correlation between the proportion of Bangladeshis and percentage of births to unmarried women in the United States with a correlation coefficient (R) of -0.139 and weighted average of 34.4%. Similarly, the statistical analysis conducted on geographies consisting of 497,645,952 people shows a moderate positive correlation between the proportion of Poles and percentage of births to unmarried women in the United States with a correlation coefficient (R) of 0.415 and weighted average of 30.8%, a difference of 11.7%.
Births to Unmarried Women Correlation Summary
| Measurement | Bangladeshi | Polish |
| Minimum | 7.6% | 4.8% |
| Maximum | 59.1% | 100.0% |
| Range | 51.5% | 95.2% |
| Mean | 36.4% | 34.7% |
| Median | 35.5% | 30.0% |
| Interquartile 25% (IQ1) | 30.0% | 25.6% |
| Interquartile 75% (IQ3) | 42.6% | 34.5% |
| Interquartile Range (IQR) | 12.6% | 9.0% |
| Standard Deviation (Sample) | 10.4% | 20.7% |
| Standard Deviation (Population) | 10.3% | 20.6% |
Similar Demographics by Births to Unmarried Women
Demographics Similar to Bangladeshis by Births to Unmarried Women
In terms of births to unmarried women, the demographic groups most similar to Bangladeshis are French Canadian (34.4%, a difference of 0.020%), Immigrants from Zaire (34.5%, a difference of 0.24%), Native Hawaiian (34.3%, a difference of 0.31%), Immigrants from Ghana (34.5%, a difference of 0.31%), and Ghanaian (34.3%, a difference of 0.46%).
| Demographics | Rating | Rank | Births to Unmarried Women |
| Delaware | 3.3 /100 | #226 | Tragic 34.2% |
| Immigrants | Panama | 3.3 /100 | #227 | Tragic 34.2% |
| Panamanians | 3.3 /100 | #228 | Tragic 34.2% |
| Immigrants | Sierra Leone | 3.1 /100 | #229 | Tragic 34.2% |
| Ghanaians | 3.1 /100 | #230 | Tragic 34.3% |
| Native Hawaiians | 2.9 /100 | #231 | Tragic 34.3% |
| French Canadians | 2.5 /100 | #232 | Tragic 34.4% |
| Bangladeshis | 2.5 /100 | #233 | Tragic 34.4% |
| Immigrants | Zaire | 2.3 /100 | #234 | Tragic 34.5% |
| Immigrants | Ghana | 2.2 /100 | #235 | Tragic 34.5% |
| Immigrants | Cameroon | 1.6 /100 | #236 | Tragic 34.7% |
| Marshallese | 1.6 /100 | #237 | Tragic 34.8% |
| Immigrants | Cambodia | 1.6 /100 | #238 | Tragic 34.8% |
| Sierra Leoneans | 1.4 /100 | #239 | Tragic 34.9% |
| Immigrants | Middle Africa | 1.2 /100 | #240 | Tragic 34.9% |
Demographics Similar to Poles by Births to Unmarried Women
In terms of births to unmarried women, the demographic groups most similar to Poles are British (30.8%, a difference of 0.020%), Italian (30.8%, a difference of 0.11%), Yugoslavian (30.8%, a difference of 0.14%), Somali (30.7%, a difference of 0.22%), and Immigrants from Bangladesh (30.9%, a difference of 0.29%).
| Demographics | Rating | Rank | Births to Unmarried Women |
| Immigrants | North America | 81.5 /100 | #145 | Excellent 30.6% |
| Northern Europeans | 81.4 /100 | #146 | Excellent 30.6% |
| Immigrants | Oceania | 81.2 /100 | #147 | Excellent 30.6% |
| Chileans | 79.1 /100 | #148 | Good 30.7% |
| Serbians | 78.8 /100 | #149 | Good 30.7% |
| Somalis | 77.8 /100 | #150 | Good 30.7% |
| Italians | 77.0 /100 | #151 | Good 30.8% |
| Poles | 76.2 /100 | #152 | Good 30.8% |
| British | 76.0 /100 | #153 | Good 30.8% |
| Yugoslavians | 75.1 /100 | #154 | Good 30.8% |
| Immigrants | Bangladesh | 73.9 /100 | #155 | Good 30.9% |
| Carpatho Rusyns | 73.5 /100 | #156 | Good 30.9% |
| Immigrants | Eastern Africa | 72.1 /100 | #157 | Good 31.0% |
| Austrians | 69.9 /100 | #158 | Good 31.0% |
| Immigrants | England | 69.4 /100 | #159 | Good 31.1% |