Bangladeshi vs African Currently Married
COMPARE
Bangladeshi
African
Currently Married
Currently Married Comparison
Bangladeshis
Africans
43.7%
CURRENTLY MARRIED
0.1/ 100
METRIC RATING
262nd/ 347
METRIC RANK
41.8%
CURRENTLY MARRIED
0.0/ 100
METRIC RATING
307th/ 347
METRIC RANK
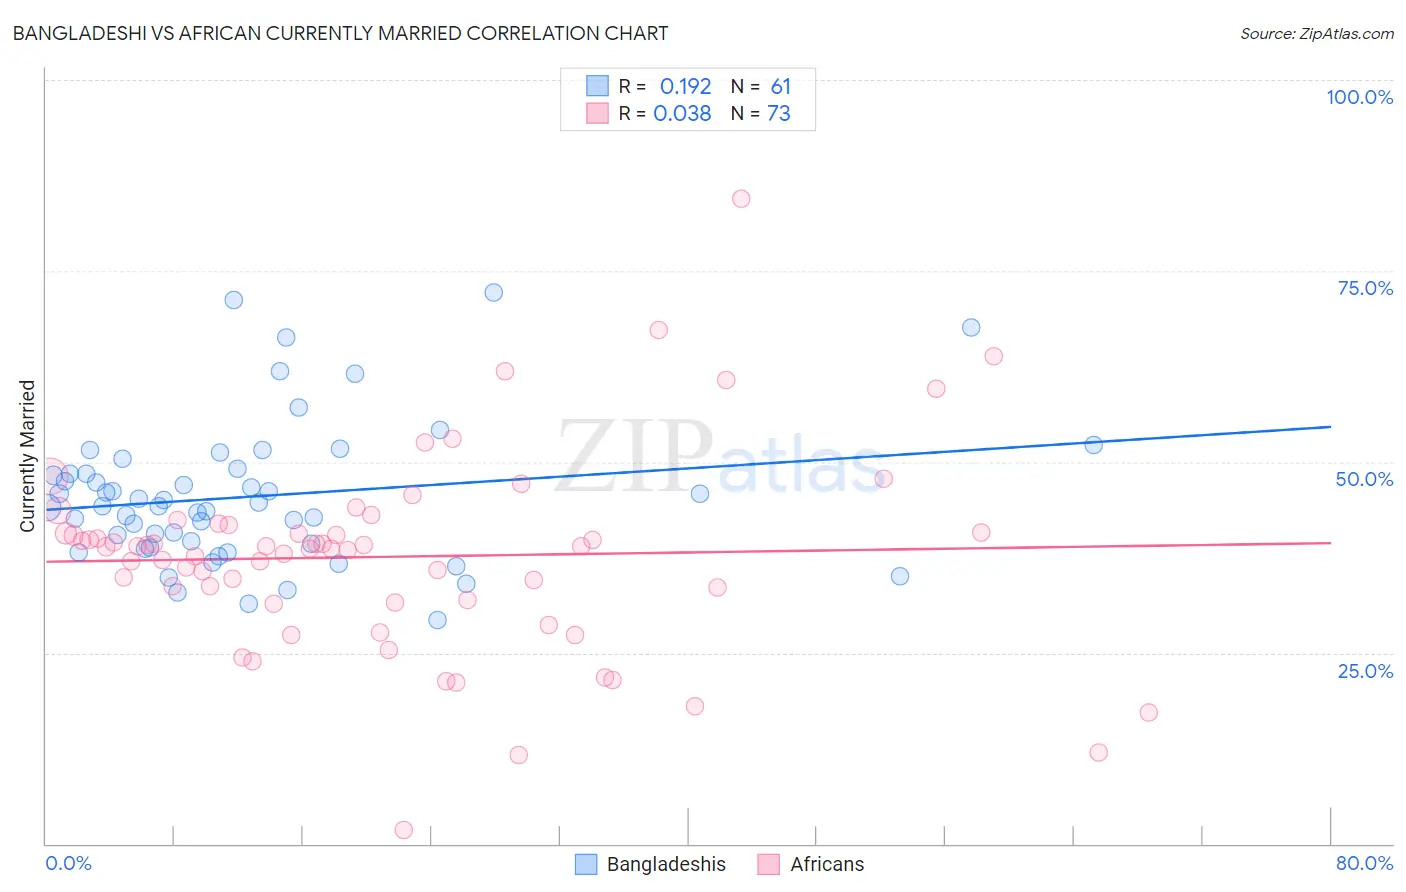
Bangladeshi vs African Currently Married Correlation Chart
The statistical analysis conducted on geographies consisting of 141,443,352 people shows a poor positive correlation between the proportion of Bangladeshis and percentage of population currently married in the United States with a correlation coefficient (R) of 0.192 and weighted average of 43.7%. Similarly, the statistical analysis conducted on geographies consisting of 470,023,481 people shows no correlation between the proportion of Africans and percentage of population currently married in the United States with a correlation coefficient (R) of 0.038 and weighted average of 41.8%, a difference of 4.4%.
Currently Married Correlation Summary
| Measurement | Bangladeshi | African |
| Minimum | 29.3% | 1.8% |
| Maximum | 72.2% | 84.5% |
| Range | 42.9% | 82.7% |
| Mean | 45.5% | 37.6% |
| Median | 44.3% | 38.9% |
| Interquartile 25% (IQ1) | 39.0% | 31.7% |
| Interquartile 75% (IQ3) | 48.8% | 41.2% |
| Interquartile Range (IQR) | 9.8% | 9.4% |
| Standard Deviation (Sample) | 9.3% | 12.9% |
| Standard Deviation (Population) | 9.2% | 12.8% |
Similar Demographics by Currently Married
Demographics Similar to Bangladeshis by Currently Married
In terms of currently married, the demographic groups most similar to Bangladeshis are Immigrants from Cuba (43.7%, a difference of 0.040%), Sudanese (43.7%, a difference of 0.050%), Immigrants from Nicaragua (43.7%, a difference of 0.14%), Immigrants from Bangladesh (43.6%, a difference of 0.14%), and Immigrants from Latin America (43.8%, a difference of 0.18%).
| Demographics | Rating | Rank | Currently Married |
| Yakama | 0.2 /100 | #255 | Tragic 44.0% |
| Shoshone | 0.2 /100 | #256 | Tragic 44.0% |
| Immigrants | Africa | 0.2 /100 | #257 | Tragic 43.9% |
| Ute | 0.2 /100 | #258 | Tragic 43.9% |
| Immigrants | Sierra Leone | 0.1 /100 | #259 | Tragic 43.8% |
| Immigrants | Latin America | 0.1 /100 | #260 | Tragic 43.8% |
| Immigrants | Nicaragua | 0.1 /100 | #261 | Tragic 43.7% |
| Bangladeshis | 0.1 /100 | #262 | Tragic 43.7% |
| Immigrants | Cuba | 0.1 /100 | #263 | Tragic 43.7% |
| Sudanese | 0.1 /100 | #264 | Tragic 43.7% |
| Immigrants | Bangladesh | 0.1 /100 | #265 | Tragic 43.6% |
| Ecuadorians | 0.1 /100 | #266 | Tragic 43.6% |
| Immigrants | Eritrea | 0.1 /100 | #267 | Tragic 43.6% |
| Spanish American Indians | 0.1 /100 | #268 | Tragic 43.6% |
| Immigrants | Sudan | 0.1 /100 | #269 | Tragic 43.5% |
Demographics Similar to Africans by Currently Married
In terms of currently married, the demographic groups most similar to Africans are Immigrants from Belize (41.8%, a difference of 0.040%), Immigrants from Guyana (41.9%, a difference of 0.13%), Immigrants from Trinidad and Tobago (41.9%, a difference of 0.14%), Immigrants from Liberia (41.8%, a difference of 0.15%), and Immigrants from Bahamas (41.9%, a difference of 0.18%).
| Demographics | Rating | Rank | Currently Married |
| Belizeans | 0.0 /100 | #300 | Tragic 42.2% |
| Immigrants | Yemen | 0.0 /100 | #301 | Tragic 42.1% |
| Immigrants | Zaire | 0.0 /100 | #302 | Tragic 42.0% |
| Sioux | 0.0 /100 | #303 | Tragic 41.9% |
| Immigrants | Bahamas | 0.0 /100 | #304 | Tragic 41.9% |
| Immigrants | Trinidad and Tobago | 0.0 /100 | #305 | Tragic 41.9% |
| Immigrants | Guyana | 0.0 /100 | #306 | Tragic 41.9% |
| Africans | 0.0 /100 | #307 | Tragic 41.8% |
| Immigrants | Belize | 0.0 /100 | #308 | Tragic 41.8% |
| Immigrants | Liberia | 0.0 /100 | #309 | Tragic 41.8% |
| Guyanese | 0.0 /100 | #310 | Tragic 41.6% |
| Trinidadians and Tobagonians | 0.0 /100 | #311 | Tragic 41.5% |
| Somalis | 0.0 /100 | #312 | Tragic 41.5% |
| Jamaicans | 0.0 /100 | #313 | Tragic 41.4% |
| West Indians | 0.0 /100 | #314 | Tragic 41.3% |