Austrian vs Immigrants from Italy Family Households with Children
COMPARE
Austrian
Immigrants from Italy
Family Households with Children
Family Households with Children Comparison
Austrians
Immigrants from Italy
27.1%
FAMILY HOUSEHOLDS WITH CHILDREN
9.9/ 100
METRIC RATING
220th/ 347
METRIC RANK
27.0%
FAMILY HOUSEHOLDS WITH CHILDREN
5.0/ 100
METRIC RATING
233rd/ 347
METRIC RANK
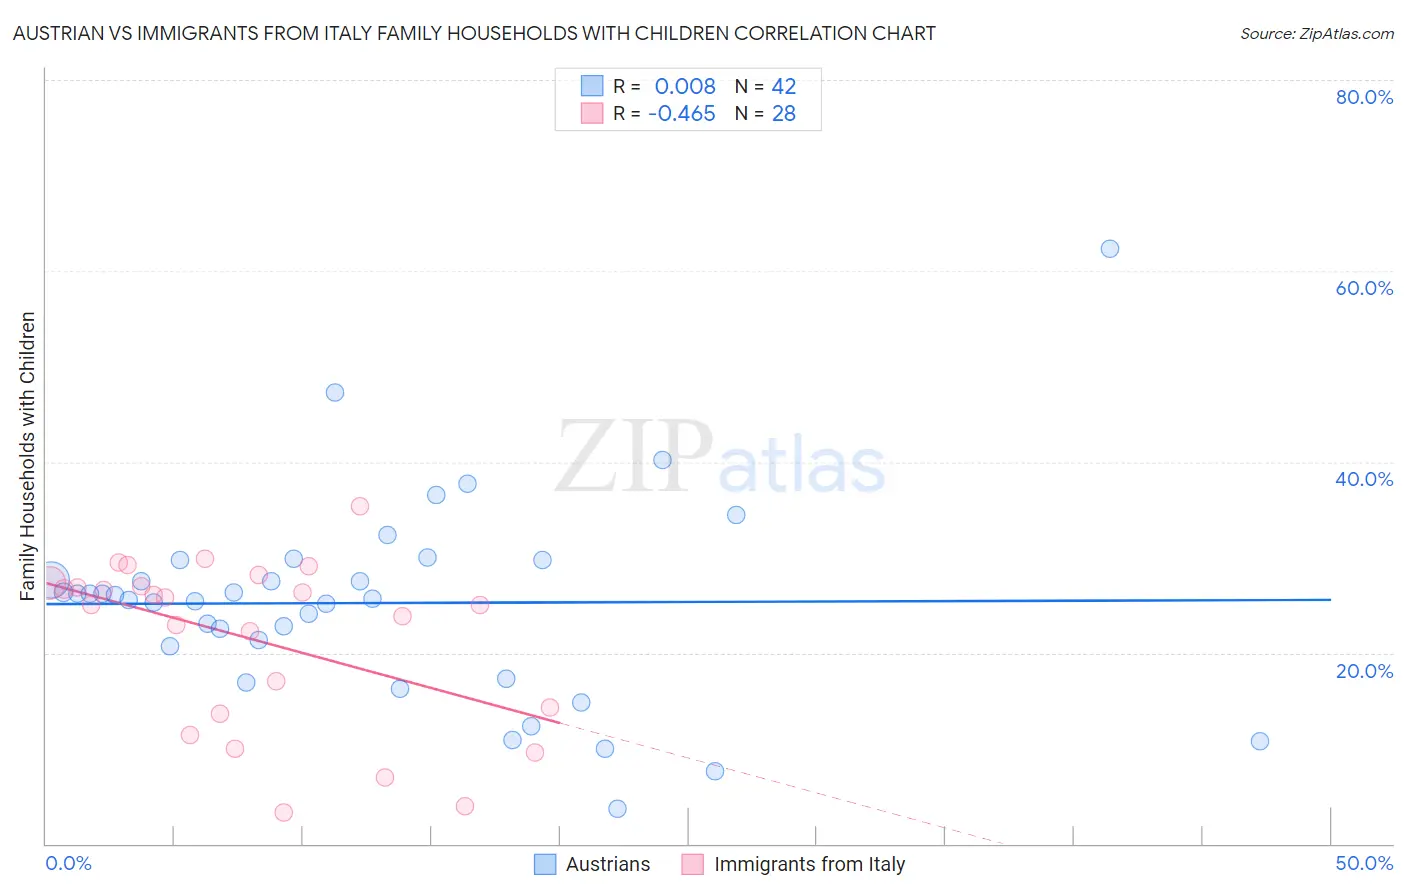
Austrian vs Immigrants from Italy Family Households with Children Correlation Chart
The statistical analysis conducted on geographies consisting of 451,563,226 people shows no correlation between the proportion of Austrians and percentage of family households with children in the United States with a correlation coefficient (R) of 0.008 and weighted average of 27.1%. Similarly, the statistical analysis conducted on geographies consisting of 323,996,481 people shows a moderate negative correlation between the proportion of Immigrants from Italy and percentage of family households with children in the United States with a correlation coefficient (R) of -0.465 and weighted average of 27.0%, a difference of 0.41%.
Family Households with Children Correlation Summary
| Measurement | Austrian | Immigrants from Italy |
| Minimum | 3.6% | 3.3% |
| Maximum | 62.3% | 35.3% |
| Range | 58.6% | 32.0% |
| Mean | 25.2% | 21.5% |
| Median | 25.9% | 25.4% |
| Interquartile 25% (IQ1) | 20.7% | 13.9% |
| Interquartile 75% (IQ3) | 29.7% | 27.2% |
| Interquartile Range (IQR) | 9.1% | 13.2% |
| Standard Deviation (Sample) | 10.6% | 8.8% |
| Standard Deviation (Population) | 10.4% | 8.6% |
Demographics Similar to Austrians and Immigrants from Italy by Family Households with Children
In terms of family households with children, the demographic groups most similar to Austrians are New Zealander (27.1%, a difference of 0.020%), Paraguayan (27.1%, a difference of 0.030%), Immigrants from Japan (27.1%, a difference of 0.050%), Pima (27.1%, a difference of 0.050%), and German (27.1%, a difference of 0.080%). Similarly, the demographic groups most similar to Immigrants from Italy are Yugoslavian (27.0%, a difference of 0.0%), Luxembourger (27.0%, a difference of 0.050%), Bulgarian (27.0%, a difference of 0.080%), Immigrants from Germany (27.0%, a difference of 0.080%), and Immigrants from Morocco (27.0%, a difference of 0.11%).
| Demographics | Rating | Rank | Family Households with Children |
| Cubans | 12.2 /100 | #216 | Poor 27.1% |
| U.S. Virgin Islanders | 12.1 /100 | #217 | Poor 27.1% |
| Greeks | 11.4 /100 | #218 | Poor 27.1% |
| Immigrants | Japan | 10.7 /100 | #219 | Poor 27.1% |
| Austrians | 9.9 /100 | #220 | Tragic 27.1% |
| New Zealanders | 9.6 /100 | #221 | Tragic 27.1% |
| Paraguayans | 9.4 /100 | #222 | Tragic 27.1% |
| Pima | 9.2 /100 | #223 | Tragic 27.1% |
| Germans | 8.7 /100 | #224 | Tragic 27.1% |
| Canadians | 7.5 /100 | #225 | Tragic 27.1% |
| Czechoslovakians | 6.6 /100 | #226 | Tragic 27.0% |
| Tsimshian | 6.6 /100 | #227 | Tragic 27.0% |
| Scottish | 6.5 /100 | #228 | Tragic 27.0% |
| Immigrants | Caribbean | 6.3 /100 | #229 | Tragic 27.0% |
| Bulgarians | 5.8 /100 | #230 | Tragic 27.0% |
| Luxembourgers | 5.5 /100 | #231 | Tragic 27.0% |
| Yugoslavians | 5.1 /100 | #232 | Tragic 27.0% |
| Immigrants | Italy | 5.0 /100 | #233 | Tragic 27.0% |
| Immigrants | Germany | 4.4 /100 | #234 | Tragic 27.0% |
| Immigrants | Morocco | 4.2 /100 | #235 | Tragic 27.0% |
| Cape Verdeans | 3.6 /100 | #236 | Tragic 26.9% |