Australian vs Tsimshian Average Family Size
COMPARE
Australian
Tsimshian
Average Family Size
Average Family Size Comparison
Australians
Tsimshian
3.13
AVERAGE FAMILY SIZE
0.1/ 100
METRIC RATING
305th/ 347
METRIC RANK
3.25
AVERAGE FAMILY SIZE
80.2/ 100
METRIC RATING
144th/ 347
METRIC RANK
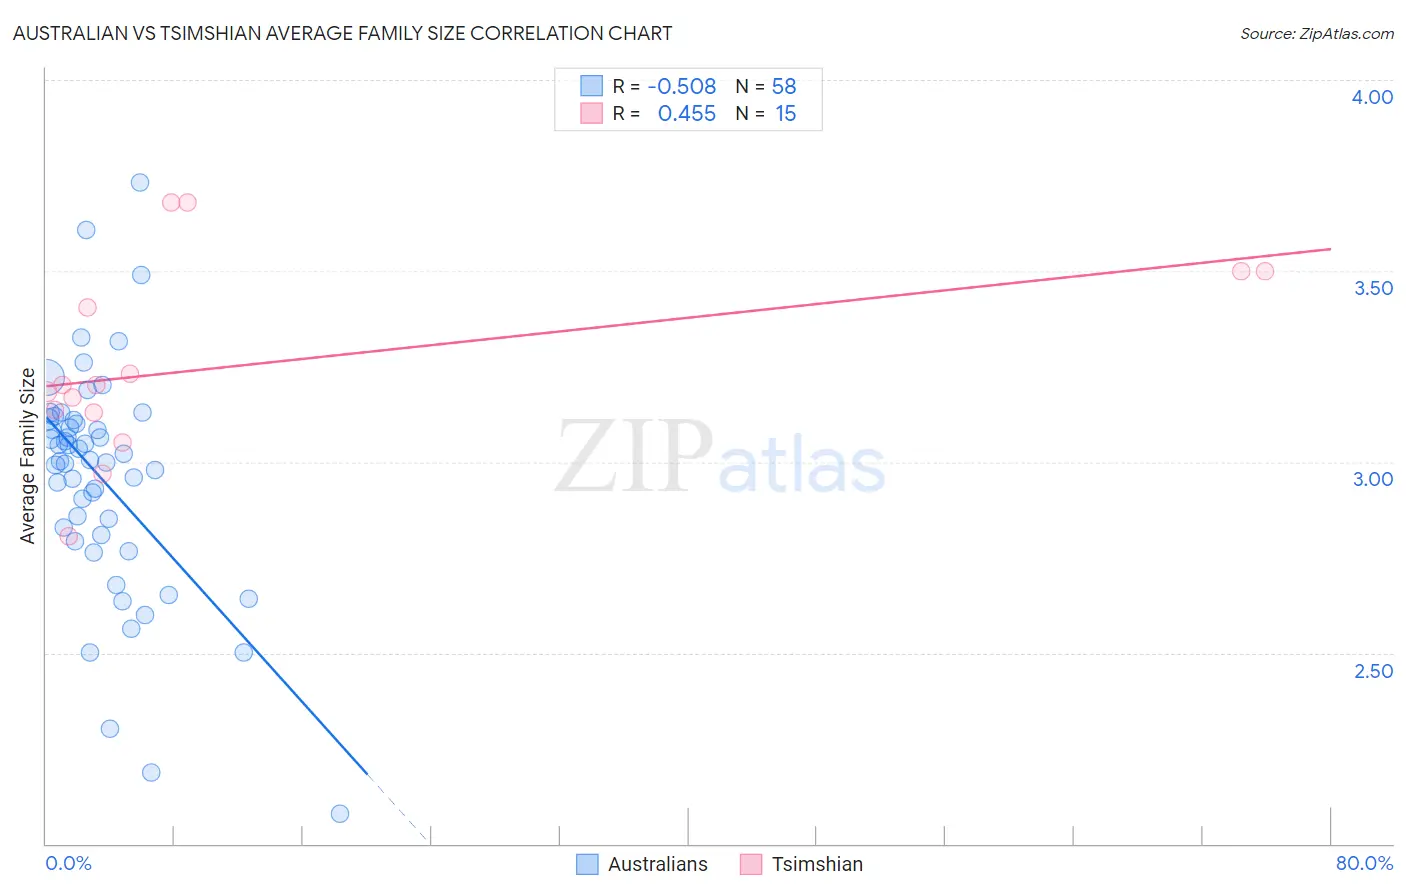
Australian vs Tsimshian Average Family Size Correlation Chart
The statistical analysis conducted on geographies consisting of 224,034,601 people shows a substantial negative correlation between the proportion of Australians and average family size in the United States with a correlation coefficient (R) of -0.508 and weighted average of 3.13. Similarly, the statistical analysis conducted on geographies consisting of 15,626,544 people shows a moderate positive correlation between the proportion of Tsimshian and average family size in the United States with a correlation coefficient (R) of 0.455 and weighted average of 3.25, a difference of 3.7%.
Average Family Size Correlation Summary
| Measurement | Australian | Tsimshian |
| Minimum | 2.08 | 2.80 |
| Maximum | 3.73 | 3.68 |
| Range | 1.65 | 0.88 |
| Mean | 2.96 | 3.26 |
| Median | 3.00 | 3.20 |
| Interquartile 25% (IQ1) | 2.81 | 3.13 |
| Interquartile 75% (IQ3) | 3.11 | 3.50 |
| Interquartile Range (IQR) | 0.30 | 0.37 |
| Standard Deviation (Sample) | 0.30 | 0.25 |
| Standard Deviation (Population) | 0.30 | 0.24 |
Similar Demographics by Average Family Size
Demographics Similar to Australians by Average Family Size
In terms of average family size, the demographic groups most similar to Australians are Immigrants from Switzerland (3.13, a difference of 0.030%), Immigrants from Latvia (3.13, a difference of 0.050%), British (3.13, a difference of 0.050%), Macedonian (3.13, a difference of 0.060%), and Immigrants from Ireland (3.13, a difference of 0.070%).
| Demographics | Rating | Rank | Average Family Size |
| Colville | 0.2 /100 | #298 | Tragic 3.14 |
| Canadians | 0.2 /100 | #299 | Tragic 3.14 |
| Immigrants | Sweden | 0.2 /100 | #300 | Tragic 3.14 |
| Macedonians | 0.2 /100 | #301 | Tragic 3.13 |
| Immigrants | Latvia | 0.2 /100 | #302 | Tragic 3.13 |
| British | 0.2 /100 | #303 | Tragic 3.13 |
| Immigrants | Switzerland | 0.2 /100 | #304 | Tragic 3.13 |
| Australians | 0.1 /100 | #305 | Tragic 3.13 |
| Immigrants | Ireland | 0.1 /100 | #306 | Tragic 3.13 |
| Immigrants | Serbia | 0.1 /100 | #307 | Tragic 3.13 |
| Slavs | 0.1 /100 | #308 | Tragic 3.13 |
| Northern Europeans | 0.1 /100 | #309 | Tragic 3.13 |
| Czechoslovakians | 0.1 /100 | #310 | Tragic 3.13 |
| Immigrants | Northern Europe | 0.1 /100 | #311 | Tragic 3.13 |
| Immigrants | Australia | 0.1 /100 | #312 | Tragic 3.13 |
Demographics Similar to Tsimshian by Average Family Size
In terms of average family size, the demographic groups most similar to Tsimshian are Bhutanese (3.25, a difference of 0.020%), Liberian (3.25, a difference of 0.030%), Immigrants from Ethiopia (3.25, a difference of 0.040%), Subsaharan African (3.25, a difference of 0.040%), and Venezuelan (3.25, a difference of 0.040%).
| Demographics | Rating | Rank | Average Family Size |
| Immigrants | Middle Africa | 82.4 /100 | #137 | Excellent 3.25 |
| Cubans | 81.8 /100 | #138 | Excellent 3.25 |
| Immigrants | Ethiopia | 81.6 /100 | #139 | Excellent 3.25 |
| Sub-Saharan Africans | 81.6 /100 | #140 | Excellent 3.25 |
| Venezuelans | 81.4 /100 | #141 | Excellent 3.25 |
| Liberians | 81.2 /100 | #142 | Excellent 3.25 |
| Bhutanese | 81.0 /100 | #143 | Excellent 3.25 |
| Tsimshian | 80.2 /100 | #144 | Excellent 3.25 |
| Armenians | 78.2 /100 | #145 | Good 3.25 |
| Immigrants | Africa | 77.9 /100 | #146 | Good 3.25 |
| Immigrants | Jordan | 75.7 /100 | #147 | Good 3.24 |
| Blackfeet | 75.0 /100 | #148 | Good 3.24 |
| Assyrians/Chaldeans/Syriacs | 73.8 /100 | #149 | Good 3.24 |
| Indians (Asian) | 73.6 /100 | #150 | Good 3.24 |
| Jordanians | 73.5 /100 | #151 | Good 3.24 |