Armenian vs Senegalese Single Father Households
COMPARE
Armenian
Senegalese
Single Father Households
Single Father Households Comparison
Armenians
Senegalese
2.1%
SINGLE FATHER HOUSEHOLDS
99.7/ 100
METRIC RATING
81st/ 347
METRIC RANK
2.3%
SINGLE FATHER HOUSEHOLDS
88.4/ 100
METRIC RATING
149th/ 347
METRIC RANK
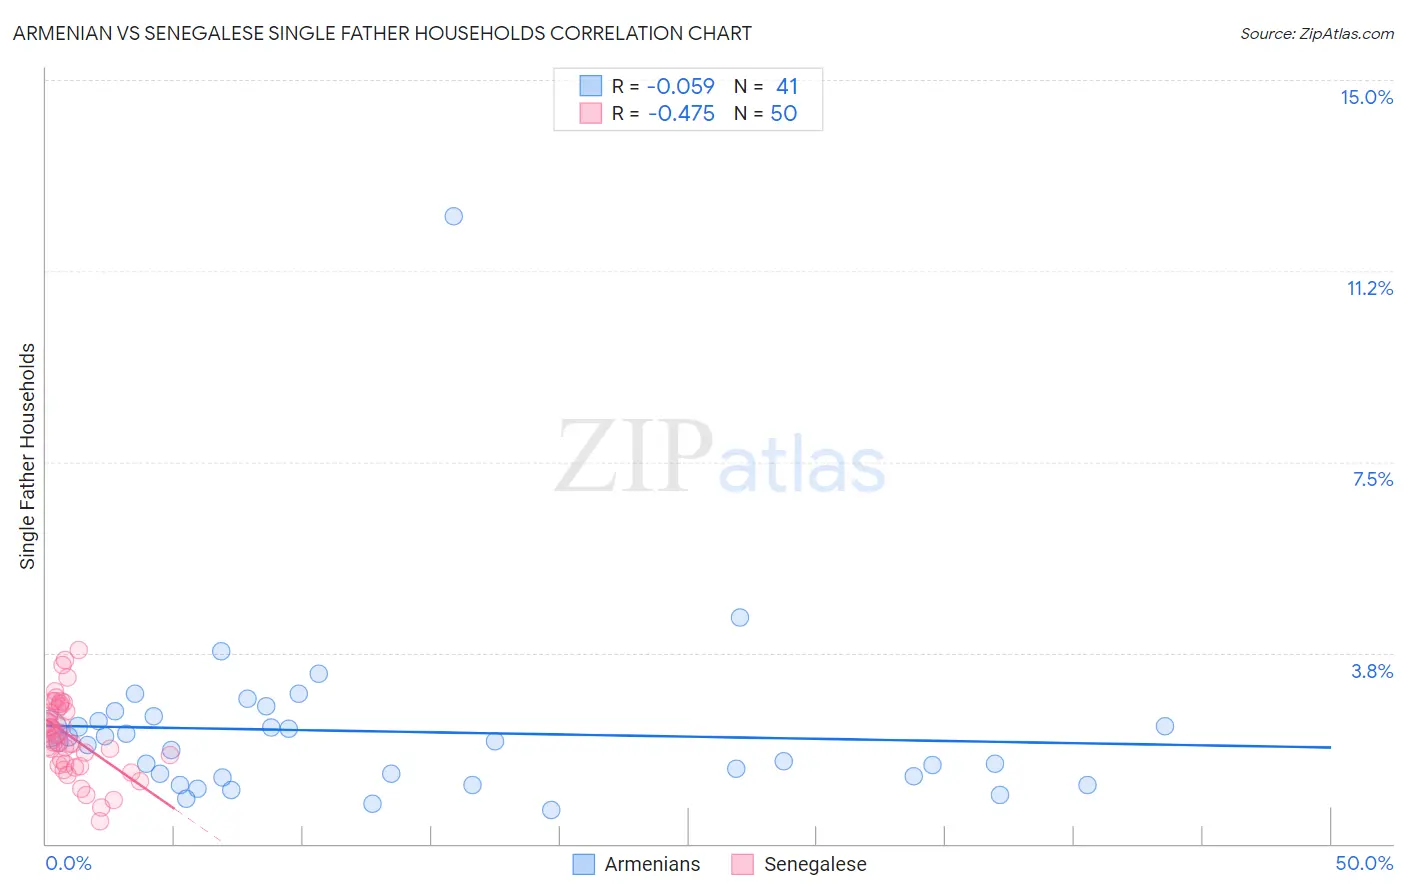
Armenian vs Senegalese Single Father Households Correlation Chart
The statistical analysis conducted on geographies consisting of 308,570,699 people shows a slight negative correlation between the proportion of Armenians and percentage of single father households in the United States with a correlation coefficient (R) of -0.059 and weighted average of 2.1%. Similarly, the statistical analysis conducted on geographies consisting of 77,943,775 people shows a moderate negative correlation between the proportion of Senegalese and percentage of single father households in the United States with a correlation coefficient (R) of -0.475 and weighted average of 2.3%, a difference of 7.7%.
Single Father Households Correlation Summary
| Measurement | Armenian | Senegalese |
| Minimum | 0.66% | 0.44% |
| Maximum | 12.3% | 3.8% |
| Range | 11.7% | 3.4% |
| Mean | 2.2% | 2.1% |
| Median | 2.0% | 2.1% |
| Interquartile 25% (IQ1) | 1.3% | 1.6% |
| Interquartile 75% (IQ3) | 2.5% | 2.7% |
| Interquartile Range (IQR) | 1.1% | 1.1% |
| Standard Deviation (Sample) | 1.8% | 0.74% |
| Standard Deviation (Population) | 1.8% | 0.73% |
Similar Demographics by Single Father Households
Demographics Similar to Armenians by Single Father Households
In terms of single father households, the demographic groups most similar to Armenians are New Zealander (2.1%, a difference of 0.050%), Greek (2.1%, a difference of 0.060%), Immigrants from South Africa (2.1%, a difference of 0.080%), Immigrants from Asia (2.1%, a difference of 0.17%), and Estonian (2.1%, a difference of 0.28%).
| Demographics | Rating | Rank | Single Father Households |
| Immigrants | Egypt | 99.8 /100 | #74 | Exceptional 2.1% |
| Immigrants | Sweden | 99.8 /100 | #75 | Exceptional 2.1% |
| Immigrants | Scotland | 99.8 /100 | #76 | Exceptional 2.1% |
| Immigrants | Saudi Arabia | 99.8 /100 | #77 | Exceptional 2.1% |
| Estonians | 99.7 /100 | #78 | Exceptional 2.1% |
| Immigrants | Asia | 99.7 /100 | #79 | Exceptional 2.1% |
| Immigrants | South Africa | 99.7 /100 | #80 | Exceptional 2.1% |
| Armenians | 99.7 /100 | #81 | Exceptional 2.1% |
| New Zealanders | 99.7 /100 | #82 | Exceptional 2.1% |
| Greeks | 99.7 /100 | #83 | Exceptional 2.1% |
| Carpatho Rusyns | 99.6 /100 | #84 | Exceptional 2.1% |
| Immigrants | Hungary | 99.6 /100 | #85 | Exceptional 2.1% |
| Asians | 99.6 /100 | #86 | Exceptional 2.1% |
| Lithuanians | 99.5 /100 | #87 | Exceptional 2.1% |
| Bhutanese | 99.5 /100 | #88 | Exceptional 2.1% |
Demographics Similar to Senegalese by Single Father Households
In terms of single father households, the demographic groups most similar to Senegalese are South American Indian (2.3%, a difference of 0.010%), Slavic (2.2%, a difference of 0.10%), Northern European (2.2%, a difference of 0.28%), Immigrants from Zimbabwe (2.2%, a difference of 0.36%), and Venezuelan (2.3%, a difference of 0.38%).
| Demographics | Rating | Rank | Single Father Households |
| Luxembourgers | 92.3 /100 | #142 | Exceptional 2.2% |
| Immigrants | Nepal | 92.1 /100 | #143 | Exceptional 2.2% |
| Slovaks | 90.7 /100 | #144 | Exceptional 2.2% |
| Immigrants | Zimbabwe | 90.2 /100 | #145 | Exceptional 2.2% |
| Northern Europeans | 89.8 /100 | #146 | Excellent 2.2% |
| Slavs | 88.9 /100 | #147 | Excellent 2.2% |
| South American Indians | 88.5 /100 | #148 | Excellent 2.3% |
| Senegalese | 88.4 /100 | #149 | Excellent 2.3% |
| Venezuelans | 86.2 /100 | #150 | Excellent 2.3% |
| Immigrants | Syria | 84.8 /100 | #151 | Excellent 2.3% |
| Immigrants | Venezuela | 83.2 /100 | #152 | Excellent 2.3% |
| Immigrants | Germany | 82.8 /100 | #153 | Excellent 2.3% |
| Bolivians | 81.0 /100 | #154 | Excellent 2.3% |
| Europeans | 80.9 /100 | #155 | Excellent 2.3% |
| Immigrants | South America | 79.9 /100 | #156 | Good 2.3% |