Arapaho vs French Canadian Married-couple Households
COMPARE
Arapaho
French Canadian
Married-couple Households
Married-couple Households Comparison
Arapaho
French Canadians
41.8%
MARRIED-COUPLE HOUSEHOLDS
0.0/ 100
METRIC RATING
297th/ 347
METRIC RANK
47.5%
MARRIED-COUPLE HOUSEHOLDS
92.4/ 100
METRIC RATING
117th/ 347
METRIC RANK
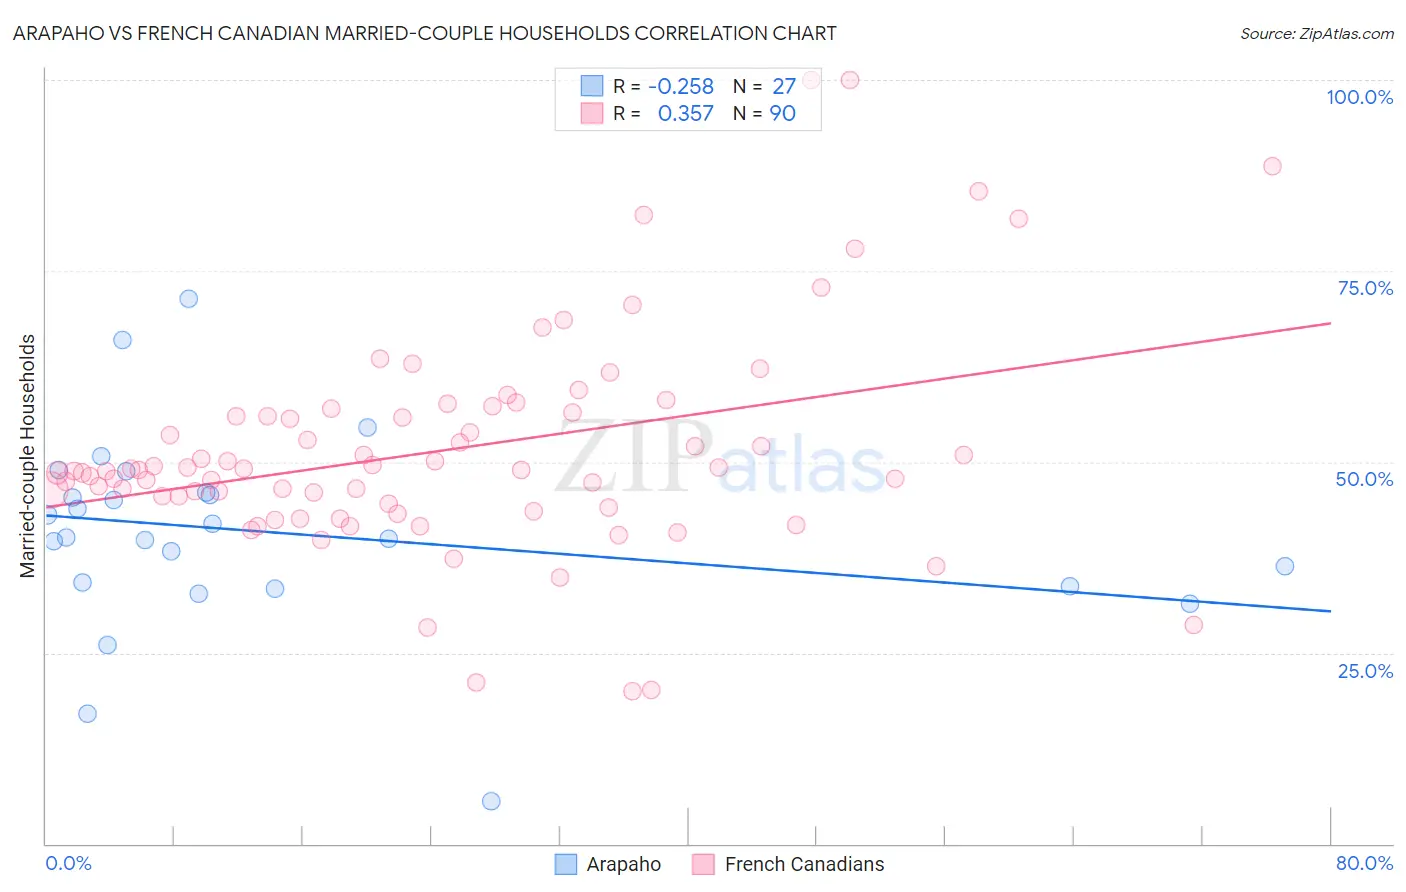
Arapaho vs French Canadian Married-couple Households Correlation Chart
The statistical analysis conducted on geographies consisting of 29,778,233 people shows a weak negative correlation between the proportion of Arapaho and percentage of married-couple family households in the United States with a correlation coefficient (R) of -0.258 and weighted average of 41.8%. Similarly, the statistical analysis conducted on geographies consisting of 502,245,459 people shows a mild positive correlation between the proportion of French Canadians and percentage of married-couple family households in the United States with a correlation coefficient (R) of 0.357 and weighted average of 47.5%, a difference of 13.7%.
Married-couple Households Correlation Summary
| Measurement | Arapaho | French Canadian |
| Minimum | 5.6% | 19.9% |
| Maximum | 71.4% | 100.0% |
| Range | 65.7% | 80.1% |
| Mean | 40.7% | 51.6% |
| Median | 40.1% | 48.9% |
| Interquartile 25% (IQ1) | 33.7% | 44.5% |
| Interquartile 75% (IQ3) | 46.0% | 56.5% |
| Interquartile Range (IQR) | 12.2% | 12.0% |
| Standard Deviation (Sample) | 13.1% | 14.4% |
| Standard Deviation (Population) | 12.8% | 14.4% |
Similar Demographics by Married-couple Households
Demographics Similar to Arapaho by Married-couple Households
In terms of married-couple households, the demographic groups most similar to Arapaho are Immigrants from Middle Africa (41.8%, a difference of 0.040%), Immigrants from Ghana (41.8%, a difference of 0.11%), Immigrants from Belize (41.8%, a difference of 0.13%), Immigrants from Sudan (41.9%, a difference of 0.30%), and Immigrants from Bahamas (41.7%, a difference of 0.34%).
| Demographics | Rating | Rank | Married-couple Households |
| Hondurans | 0.0 /100 | #290 | Tragic 42.1% |
| Paiute | 0.0 /100 | #291 | Tragic 42.1% |
| Indonesians | 0.0 /100 | #292 | Tragic 42.0% |
| Menominee | 0.0 /100 | #293 | Tragic 42.0% |
| Immigrants | Yemen | 0.0 /100 | #294 | Tragic 42.0% |
| Kiowa | 0.0 /100 | #295 | Tragic 42.0% |
| Immigrants | Sudan | 0.0 /100 | #296 | Tragic 41.9% |
| Arapaho | 0.0 /100 | #297 | Tragic 41.8% |
| Immigrants | Middle Africa | 0.0 /100 | #298 | Tragic 41.8% |
| Immigrants | Ghana | 0.0 /100 | #299 | Tragic 41.8% |
| Immigrants | Belize | 0.0 /100 | #300 | Tragic 41.8% |
| Immigrants | Bahamas | 0.0 /100 | #301 | Tragic 41.7% |
| Immigrants | Honduras | 0.0 /100 | #302 | Tragic 41.6% |
| Sub-Saharan Africans | 0.0 /100 | #303 | Tragic 41.6% |
| Immigrants | Guyana | 0.0 /100 | #304 | Tragic 41.6% |
Demographics Similar to French Canadians by Married-couple Households
In terms of married-couple households, the demographic groups most similar to French Canadians are Argentinean (47.5%, a difference of 0.010%), Immigrants from Germany (47.5%, a difference of 0.010%), Chilean (47.5%, a difference of 0.030%), Slovak (47.6%, a difference of 0.060%), and Immigrants from Europe (47.6%, a difference of 0.18%).
| Demographics | Rating | Rank | Married-couple Households |
| Macedonians | 93.9 /100 | #110 | Exceptional 47.6% |
| Syrians | 93.9 /100 | #111 | Exceptional 47.6% |
| Peruvians | 93.8 /100 | #112 | Exceptional 47.6% |
| Venezuelans | 93.8 /100 | #113 | Exceptional 47.6% |
| Immigrants | Europe | 93.7 /100 | #114 | Exceptional 47.6% |
| Slovaks | 92.9 /100 | #115 | Exceptional 47.6% |
| Argentineans | 92.5 /100 | #116 | Exceptional 47.5% |
| French Canadians | 92.4 /100 | #117 | Exceptional 47.5% |
| Immigrants | Germany | 92.4 /100 | #118 | Exceptional 47.5% |
| Chileans | 92.2 /100 | #119 | Exceptional 47.5% |
| Puget Sound Salish | 90.5 /100 | #120 | Exceptional 47.4% |
| Immigrants | Eastern Europe | 90.3 /100 | #121 | Exceptional 47.4% |
| Okinawans | 90.1 /100 | #122 | Exceptional 47.4% |
| Immigrants | Venezuela | 89.3 /100 | #123 | Excellent 47.4% |
| Zimbabweans | 89.2 /100 | #124 | Excellent 47.4% |