American vs Immigrants from Micronesia Average Family Size
COMPARE
American
Immigrants from Micronesia
Average Family Size
Average Family Size Comparison
Americans
Immigrants from Micronesia
3.16
AVERAGE FAMILY SIZE
1.0/ 100
METRIC RATING
264th/ 347
METRIC RANK
3.32
AVERAGE FAMILY SIZE
99.8/ 100
METRIC RATING
78th/ 347
METRIC RANK
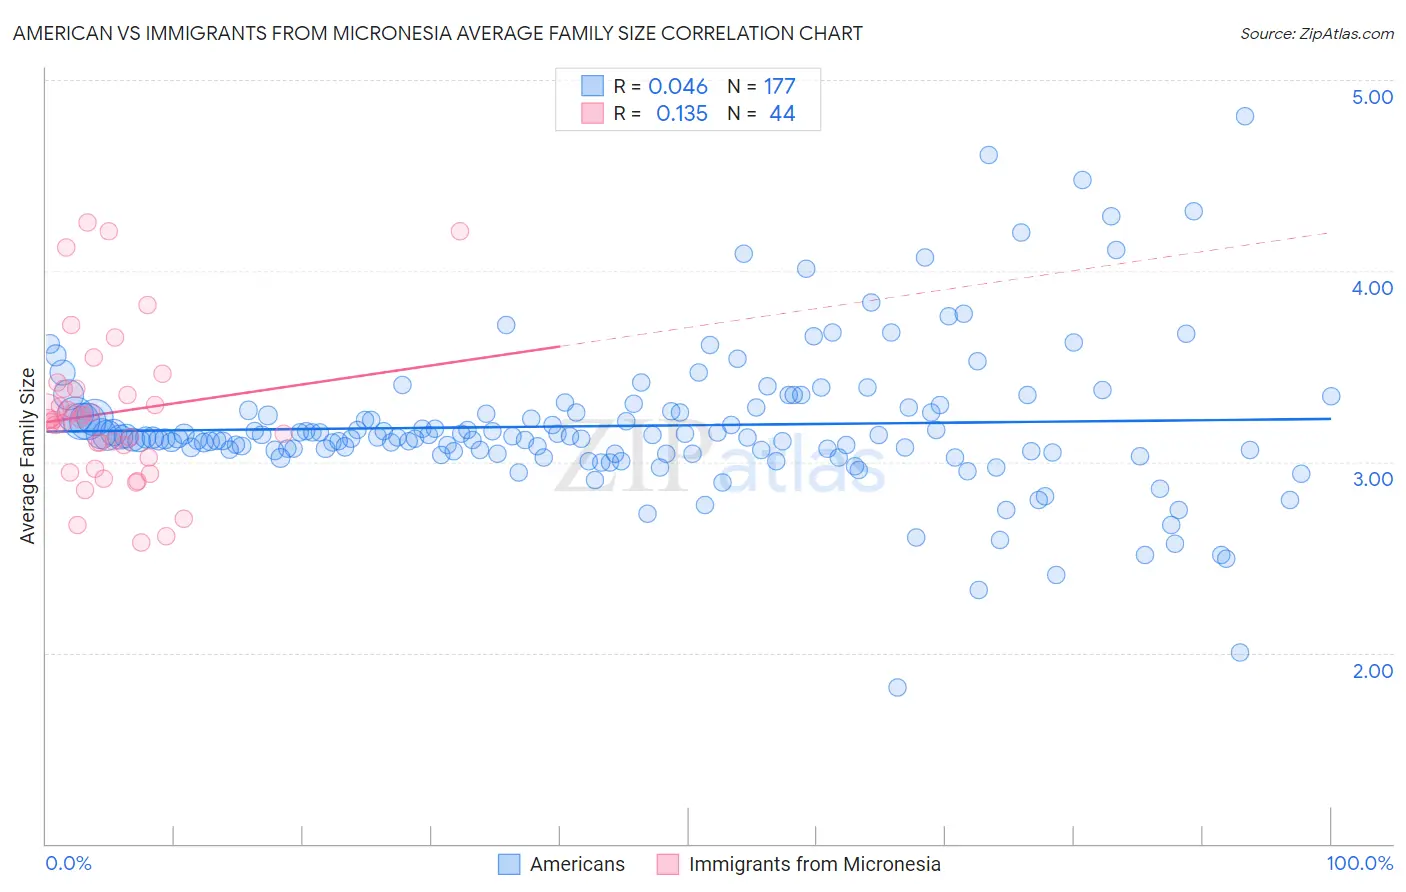
American vs Immigrants from Micronesia Average Family Size Correlation Chart
The statistical analysis conducted on geographies consisting of 581,385,339 people shows no correlation between the proportion of Americans and average family size in the United States with a correlation coefficient (R) of 0.046 and weighted average of 3.16. Similarly, the statistical analysis conducted on geographies consisting of 61,601,070 people shows a poor positive correlation between the proportion of Immigrants from Micronesia and average family size in the United States with a correlation coefficient (R) of 0.135 and weighted average of 3.32, a difference of 5.1%.
Average Family Size Correlation Summary
| Measurement | American | Immigrants from Micronesia |
| Minimum | 1.82 | 2.58 |
| Maximum | 4.81 | 4.26 |
| Range | 2.99 | 1.68 |
| Mean | 3.19 | 3.26 |
| Median | 3.13 | 3.22 |
| Interquartile 25% (IQ1) | 3.05 | 3.00 |
| Interquartile 75% (IQ3) | 3.27 | 3.38 |
| Interquartile Range (IQR) | 0.22 | 0.39 |
| Standard Deviation (Sample) | 0.39 | 0.40 |
| Standard Deviation (Population) | 0.39 | 0.40 |
Similar Demographics by Average Family Size
Demographics Similar to Americans by Average Family Size
In terms of average family size, the demographic groups most similar to Americans are Immigrants from Bulgaria (3.16, a difference of 0.020%), Immigrants from South Africa (3.16, a difference of 0.050%), Immigrants from Greece (3.16, a difference of 0.060%), Iroquois (3.16, a difference of 0.080%), and Immigrants from Russia (3.16, a difference of 0.11%).
| Demographics | Rating | Rank | Average Family Size |
| Albanians | 1.5 /100 | #257 | Tragic 3.17 |
| Turks | 1.3 /100 | #258 | Tragic 3.16 |
| Potawatomi | 1.3 /100 | #259 | Tragic 3.16 |
| Immigrants | Albania | 1.3 /100 | #260 | Tragic 3.16 |
| Immigrants | North Macedonia | 1.3 /100 | #261 | Tragic 3.16 |
| Immigrants | Russia | 1.3 /100 | #262 | Tragic 3.16 |
| Immigrants | Bulgaria | 1.0 /100 | #263 | Tragic 3.16 |
| Americans | 1.0 /100 | #264 | Tragic 3.16 |
| Immigrants | South Africa | 0.9 /100 | #265 | Tragic 3.16 |
| Immigrants | Greece | 0.9 /100 | #266 | Tragic 3.16 |
| Iroquois | 0.8 /100 | #267 | Tragic 3.16 |
| Maltese | 0.8 /100 | #268 | Tragic 3.16 |
| Immigrants | Singapore | 0.7 /100 | #269 | Tragic 3.16 |
| Tlingit-Haida | 0.7 /100 | #270 | Tragic 3.16 |
| Immigrants | Germany | 0.7 /100 | #271 | Tragic 3.15 |
Demographics Similar to Immigrants from Micronesia by Average Family Size
In terms of average family size, the demographic groups most similar to Immigrants from Micronesia are British West Indian (3.32, a difference of 0.010%), Lumbee (3.32, a difference of 0.030%), Immigrants from Ecuador (3.32, a difference of 0.040%), Trinidadian and Tobagonian (3.32, a difference of 0.050%), and Immigrants from Barbados (3.32, a difference of 0.070%).
| Demographics | Rating | Rank | Average Family Size |
| Immigrants | West Indies | 99.9 /100 | #71 | Exceptional 3.33 |
| Immigrants | Caribbean | 99.9 /100 | #72 | Exceptional 3.33 |
| Yaqui | 99.9 /100 | #73 | Exceptional 3.32 |
| Immigrants | Sierra Leone | 99.9 /100 | #74 | Exceptional 3.32 |
| Immigrants | Barbados | 99.8 /100 | #75 | Exceptional 3.32 |
| Trinidadians and Tobagonians | 99.8 /100 | #76 | Exceptional 3.32 |
| Immigrants | Ecuador | 99.8 /100 | #77 | Exceptional 3.32 |
| Immigrants | Micronesia | 99.8 /100 | #78 | Exceptional 3.32 |
| British West Indians | 99.8 /100 | #79 | Exceptional 3.32 |
| Lumbee | 99.8 /100 | #80 | Exceptional 3.32 |
| Immigrants | Dominica | 99.8 /100 | #81 | Exceptional 3.32 |
| Ecuadorians | 99.8 /100 | #82 | Exceptional 3.32 |
| Immigrants | Afghanistan | 99.8 /100 | #83 | Exceptional 3.32 |
| Immigrants | Nigeria | 99.7 /100 | #84 | Exceptional 3.32 |
| Afghans | 99.7 /100 | #85 | Exceptional 3.31 |