American vs Armenian Currently Married
COMPARE
American
Armenian
Currently Married
Currently Married Comparison
Americans
Armenians
48.0%
CURRENTLY MARRIED
95.7/ 100
METRIC RATING
90th/ 347
METRIC RANK
46.8%
CURRENTLY MARRIED
58.2/ 100
METRIC RATING
169th/ 347
METRIC RANK
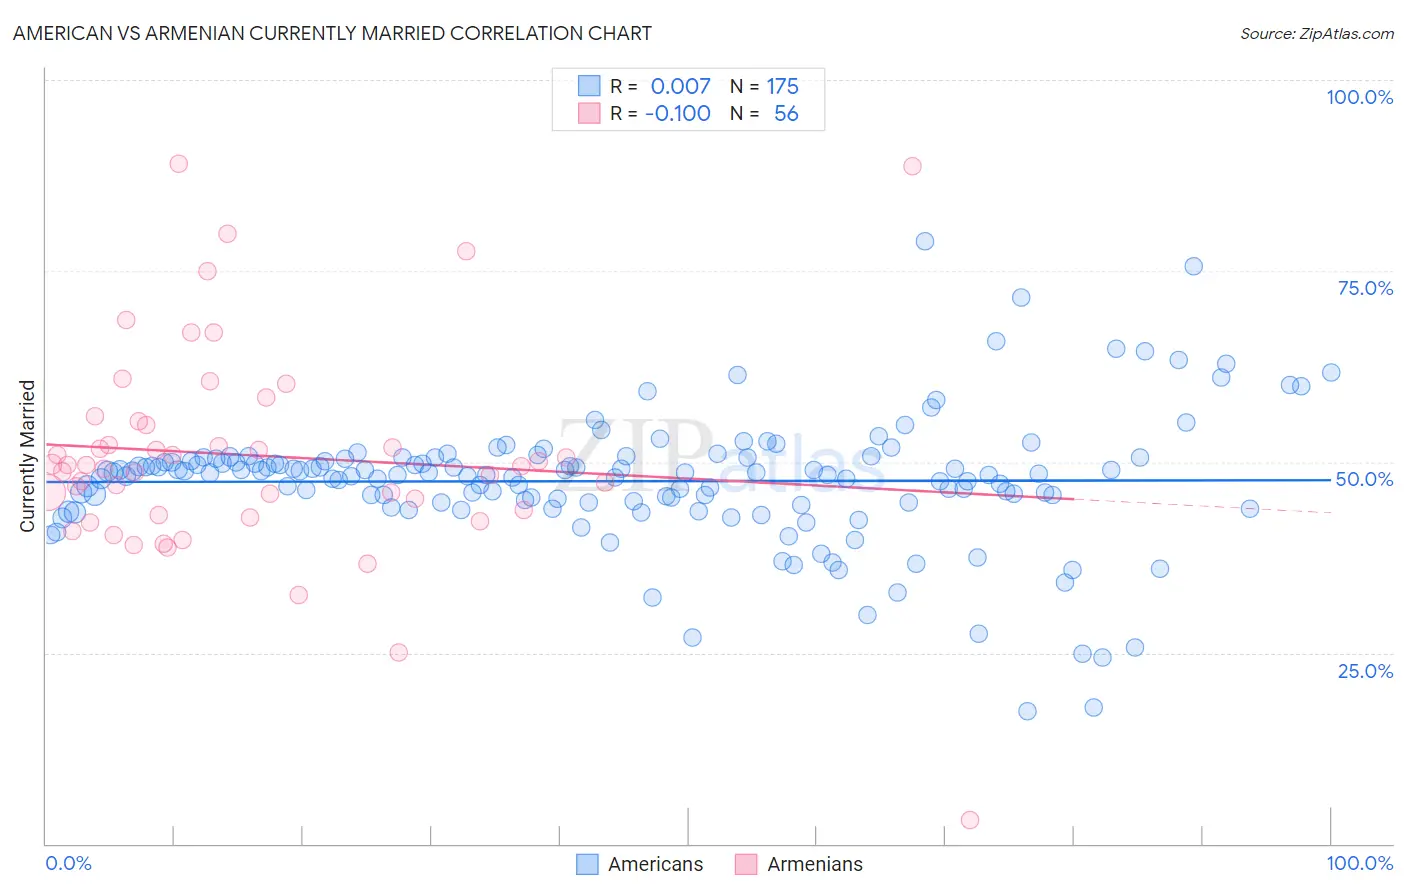
American vs Armenian Currently Married Correlation Chart
The statistical analysis conducted on geographies consisting of 581,851,049 people shows no correlation between the proportion of Americans and percentage of population currently married in the United States with a correlation coefficient (R) of 0.007 and weighted average of 48.0%. Similarly, the statistical analysis conducted on geographies consisting of 310,938,926 people shows a poor negative correlation between the proportion of Armenians and percentage of population currently married in the United States with a correlation coefficient (R) of -0.100 and weighted average of 46.8%, a difference of 2.5%.
Currently Married Correlation Summary
| Measurement | American | Armenian |
| Minimum | 17.3% | 3.1% |
| Maximum | 79.0% | 89.1% |
| Range | 61.7% | 86.0% |
| Mean | 47.5% | 50.8% |
| Median | 48.4% | 49.5% |
| Interquartile 25% (IQ1) | 44.8% | 43.4% |
| Interquartile 75% (IQ3) | 50.5% | 55.1% |
| Interquartile Range (IQR) | 5.7% | 11.7% |
| Standard Deviation (Sample) | 8.5% | 14.2% |
| Standard Deviation (Population) | 8.5% | 14.0% |
Similar Demographics by Currently Married
Demographics Similar to Americans by Currently Married
In terms of currently married, the demographic groups most similar to Americans are Indian (Asian) (48.0%, a difference of 0.020%), Immigrants from Bolivia (47.9%, a difference of 0.030%), Korean (47.9%, a difference of 0.070%), Immigrants from Eastern Europe (48.0%, a difference of 0.080%), and Jordanian (48.0%, a difference of 0.10%).
| Demographics | Rating | Rank | Currently Married |
| Bolivians | 96.9 /100 | #83 | Exceptional 48.1% |
| Immigrants | Israel | 96.9 /100 | #84 | Exceptional 48.1% |
| French Canadians | 96.3 /100 | #85 | Exceptional 48.0% |
| Immigrants | Japan | 96.2 /100 | #86 | Exceptional 48.0% |
| Jordanians | 96.2 /100 | #87 | Exceptional 48.0% |
| Immigrants | Eastern Europe | 96.1 /100 | #88 | Exceptional 48.0% |
| Indians (Asian) | 95.8 /100 | #89 | Exceptional 48.0% |
| Americans | 95.7 /100 | #90 | Exceptional 48.0% |
| Immigrants | Bolivia | 95.6 /100 | #91 | Exceptional 47.9% |
| Koreans | 95.4 /100 | #92 | Exceptional 47.9% |
| Lebanese | 95.1 /100 | #93 | Exceptional 47.9% |
| Native Hawaiians | 95.0 /100 | #94 | Exceptional 47.9% |
| Immigrants | Bulgaria | 94.8 /100 | #95 | Exceptional 47.9% |
| Egyptians | 94.8 /100 | #96 | Exceptional 47.9% |
| Immigrants | Ukraine | 94.8 /100 | #97 | Exceptional 47.9% |
Demographics Similar to Armenians by Currently Married
In terms of currently married, the demographic groups most similar to Armenians are Immigrants from Afghanistan (46.8%, a difference of 0.0%), Spaniard (46.8%, a difference of 0.020%), Immigrants from Syria (46.8%, a difference of 0.040%), Immigrants from Latvia (46.7%, a difference of 0.050%), and Samoan (46.8%, a difference of 0.060%).
| Demographics | Rating | Rank | Currently Married |
| Immigrants | Nonimmigrants | 65.4 /100 | #162 | Good 46.9% |
| Delaware | 64.7 /100 | #163 | Good 46.9% |
| Immigrants | Western Asia | 64.2 /100 | #164 | Good 46.9% |
| Samoans | 59.8 /100 | #165 | Average 46.8% |
| Immigrants | Syria | 59.3 /100 | #166 | Average 46.8% |
| Spaniards | 58.8 /100 | #167 | Average 46.8% |
| Immigrants | Afghanistan | 58.2 /100 | #168 | Average 46.8% |
| Armenians | 58.2 /100 | #169 | Average 46.8% |
| Immigrants | Latvia | 56.7 /100 | #170 | Average 46.7% |
| Immigrants | Zimbabwe | 52.4 /100 | #171 | Average 46.7% |
| Aleuts | 52.0 /100 | #172 | Average 46.7% |
| Tlingit-Haida | 51.2 /100 | #173 | Average 46.7% |
| Peruvians | 50.0 /100 | #174 | Average 46.6% |
| Immigrants | Brazil | 49.9 /100 | #175 | Average 46.6% |
| Hawaiians | 48.6 /100 | #176 | Average 46.6% |