Alsatian vs Pakistani Single Mother Households
COMPARE
Alsatian
Pakistani
Single Mother Households
Single Mother Households Comparison
Alsatians
Pakistanis
6.2%
SINGLE MOTHER HOUSEHOLDS
68.7/ 100
METRIC RATING
163rd/ 347
METRIC RANK
6.1%
SINGLE MOTHER HOUSEHOLDS
79.2/ 100
METRIC RATING
152nd/ 347
METRIC RANK
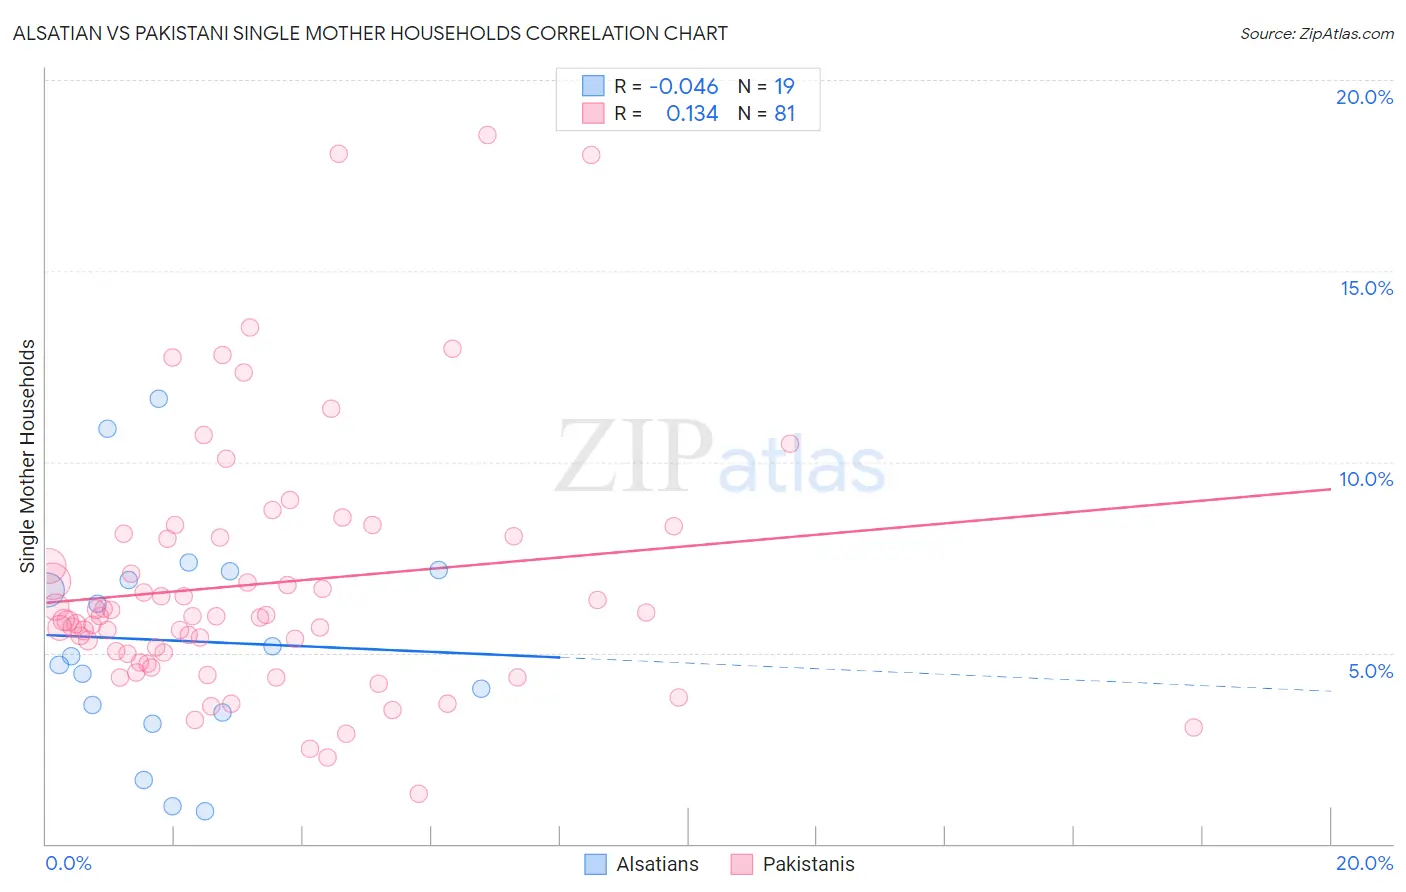
Alsatian vs Pakistani Single Mother Households Correlation Chart
The statistical analysis conducted on geographies consisting of 82,530,360 people shows no correlation between the proportion of Alsatians and percentage of single mother households in the United States with a correlation coefficient (R) of -0.046 and weighted average of 6.2%. Similarly, the statistical analysis conducted on geographies consisting of 334,696,981 people shows a poor positive correlation between the proportion of Pakistanis and percentage of single mother households in the United States with a correlation coefficient (R) of 0.134 and weighted average of 6.1%, a difference of 1.6%.
Single Mother Households Correlation Summary
| Measurement | Alsatian | Pakistani |
| Minimum | 0.84% | 1.3% |
| Maximum | 11.6% | 18.6% |
| Range | 10.8% | 17.3% |
| Mean | 5.3% | 6.8% |
| Median | 4.9% | 6.0% |
| Interquartile 25% (IQ1) | 3.4% | 4.9% |
| Interquartile 75% (IQ3) | 7.1% | 8.0% |
| Interquartile Range (IQR) | 3.7% | 3.2% |
| Standard Deviation (Sample) | 2.9% | 3.4% |
| Standard Deviation (Population) | 2.8% | 3.4% |
Demographics Similar to Alsatians and Pakistanis by Single Mother Households
In terms of single mother households, the demographic groups most similar to Alsatians are Immigrants from Northern Africa (6.2%, a difference of 0.090%), Immigrants from Zimbabwe (6.2%, a difference of 0.16%), Immigrants from Syria (6.2%, a difference of 0.16%), Immigrants from Germany (6.1%, a difference of 0.51%), and Iraqi (6.1%, a difference of 0.59%). Similarly, the demographic groups most similar to Pakistanis are Immigrants from Brazil (6.1%, a difference of 0.040%), Immigrants from Philippines (6.1%, a difference of 0.11%), Immigrants from Southern Europe (6.1%, a difference of 0.23%), Zimbabwean (6.1%, a difference of 0.28%), and Immigrants from Albania (6.1%, a difference of 0.42%).
| Demographics | Rating | Rank | Single Mother Households |
| Immigrants | Jordan | 82.3 /100 | #147 | Excellent 6.0% |
| Scotch-Irish | 82.0 /100 | #148 | Excellent 6.0% |
| Immigrants | Albania | 81.5 /100 | #149 | Excellent 6.1% |
| Zimbabweans | 80.7 /100 | #150 | Excellent 6.1% |
| Immigrants | Southern Europe | 80.5 /100 | #151 | Excellent 6.1% |
| Pakistanis | 79.2 /100 | #152 | Good 6.1% |
| Immigrants | Brazil | 78.9 /100 | #153 | Good 6.1% |
| Immigrants | Philippines | 78.5 /100 | #154 | Good 6.1% |
| Whites/Caucasians | 76.5 /100 | #155 | Good 6.1% |
| Native Hawaiians | 75.0 /100 | #156 | Good 6.1% |
| Chileans | 74.2 /100 | #157 | Good 6.1% |
| Celtics | 73.3 /100 | #158 | Good 6.1% |
| Yugoslavians | 73.1 /100 | #159 | Good 6.1% |
| Iraqis | 73.0 /100 | #160 | Good 6.1% |
| Immigrants | Germany | 72.4 /100 | #161 | Good 6.1% |
| Immigrants | Zimbabwe | 69.9 /100 | #162 | Good 6.2% |
| Alsatians | 68.7 /100 | #163 | Good 6.2% |
| Immigrants | Northern Africa | 68.0 /100 | #164 | Good 6.2% |
| Immigrants | Syria | 67.4 /100 | #165 | Good 6.2% |
| Sri Lankans | 63.9 /100 | #166 | Good 6.2% |
| Brazilians | 59.1 /100 | #167 | Average 6.2% |