Alsatian vs Immigrants from Southern Europe Divorced or Separated
COMPARE
Alsatian
Immigrants from Southern Europe
Divorced or Separated
Divorced or Separated Comparison
Alsatians
Immigrants from Southern Europe
11.9%
DIVORCED OR SEPARATED
84.0/ 100
METRIC RATING
137th/ 347
METRIC RANK
11.6%
DIVORCED OR SEPARATED
99.1/ 100
METRIC RATING
89th/ 347
METRIC RANK
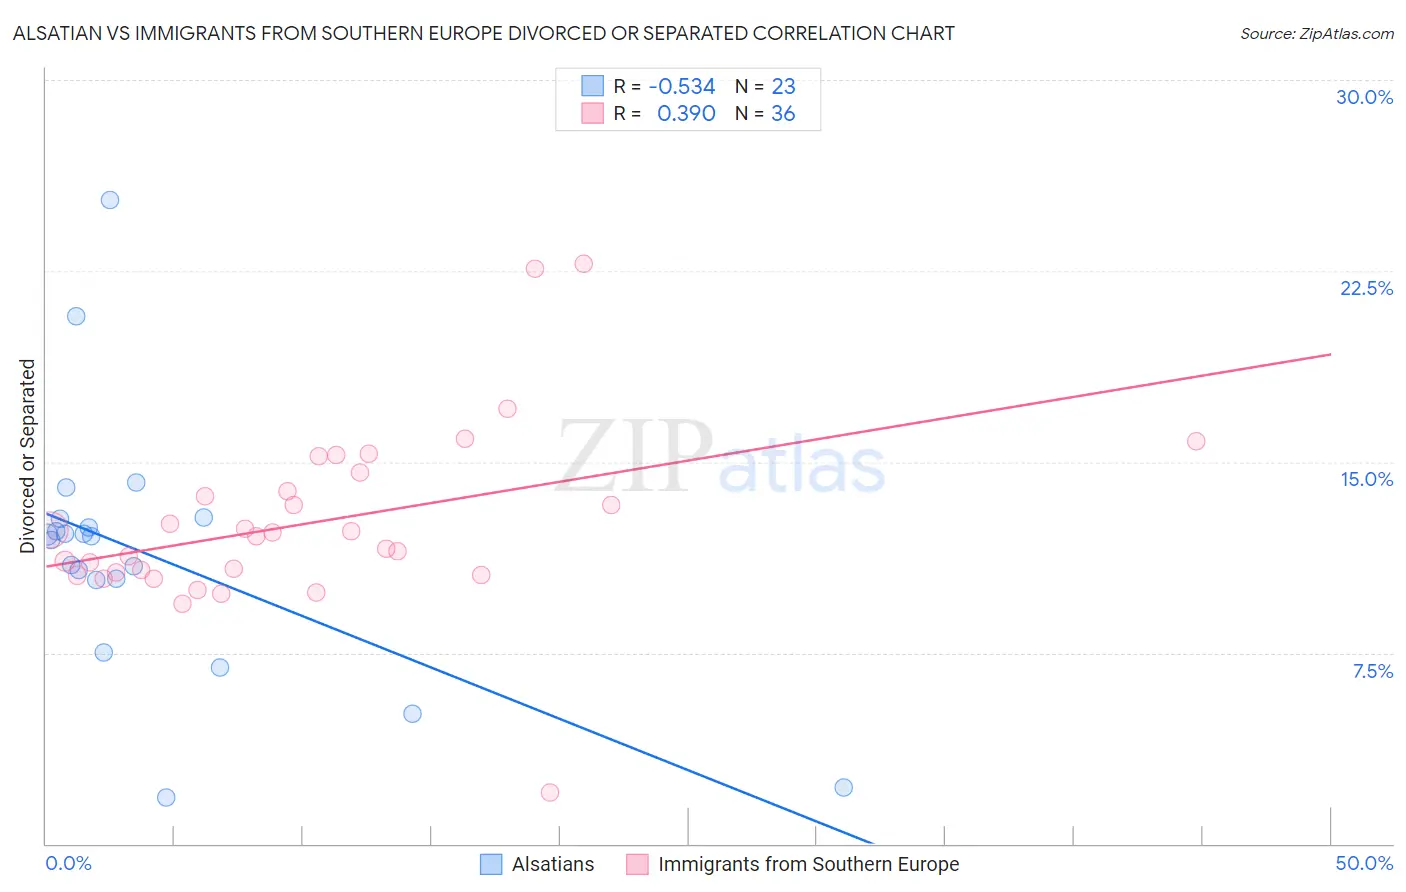
Alsatian vs Immigrants from Southern Europe Divorced or Separated Correlation Chart
The statistical analysis conducted on geographies consisting of 82,679,832 people shows a substantial negative correlation between the proportion of Alsatians and percentage of population currently divorced or separated in the United States with a correlation coefficient (R) of -0.534 and weighted average of 11.9%. Similarly, the statistical analysis conducted on geographies consisting of 402,653,833 people shows a mild positive correlation between the proportion of Immigrants from Southern Europe and percentage of population currently divorced or separated in the United States with a correlation coefficient (R) of 0.390 and weighted average of 11.6%, a difference of 2.8%.
Divorced or Separated Correlation Summary
| Measurement | Alsatian | Immigrants from Southern Europe |
| Minimum | 1.8% | 2.0% |
| Maximum | 25.3% | 22.8% |
| Range | 23.5% | 20.8% |
| Mean | 11.4% | 12.6% |
| Median | 12.1% | 12.1% |
| Interquartile 25% (IQ1) | 10.4% | 10.6% |
| Interquartile 75% (IQ3) | 12.8% | 14.2% |
| Interquartile Range (IQR) | 2.4% | 3.6% |
| Standard Deviation (Sample) | 5.0% | 3.6% |
| Standard Deviation (Population) | 4.9% | 3.6% |
Similar Demographics by Divorced or Separated
Demographics Similar to Alsatians by Divorced or Separated
In terms of divorced or separated, the demographic groups most similar to Alsatians are Immigrants from Netherlands (11.9%, a difference of 0.0%), Australian (11.9%, a difference of 0.020%), Lebanese (11.9%, a difference of 0.040%), Danish (11.9%, a difference of 0.060%), and Carpatho Rusyn (11.9%, a difference of 0.060%).
| Demographics | Rating | Rank | Divorced or Separated |
| Immigrants | Austria | 88.2 /100 | #130 | Excellent 11.8% |
| Immigrants | Cambodia | 88.2 /100 | #131 | Excellent 11.8% |
| Immigrants | Afghanistan | 87.9 /100 | #132 | Excellent 11.8% |
| New Zealanders | 87.5 /100 | #133 | Excellent 11.9% |
| Argentineans | 85.1 /100 | #134 | Excellent 11.9% |
| Danes | 84.8 /100 | #135 | Excellent 11.9% |
| Carpatho Rusyns | 84.8 /100 | #136 | Excellent 11.9% |
| Alsatians | 84.0 /100 | #137 | Excellent 11.9% |
| Immigrants | Netherlands | 83.9 /100 | #138 | Excellent 11.9% |
| Australians | 83.6 /100 | #139 | Excellent 11.9% |
| Lebanese | 83.4 /100 | #140 | Excellent 11.9% |
| Immigrants | Morocco | 82.9 /100 | #141 | Excellent 11.9% |
| Immigrants | Zimbabwe | 81.5 /100 | #142 | Excellent 11.9% |
| Pakistanis | 81.3 /100 | #143 | Excellent 11.9% |
| Peruvians | 80.9 /100 | #144 | Excellent 11.9% |
Demographics Similar to Immigrants from Southern Europe by Divorced or Separated
In terms of divorced or separated, the demographic groups most similar to Immigrants from Southern Europe are Immigrants from Europe (11.6%, a difference of 0.040%), Immigrants from Nepal (11.6%, a difference of 0.070%), Immigrants from Latvia (11.6%, a difference of 0.090%), Zimbabwean (11.6%, a difference of 0.10%), and Spanish American Indian (11.6%, a difference of 0.14%).
| Demographics | Rating | Rank | Divorced or Separated |
| Immigrants | Romania | 99.3 /100 | #82 | Exceptional 11.5% |
| Immigrants | Bulgaria | 99.3 /100 | #83 | Exceptional 11.5% |
| Bulgarians | 99.3 /100 | #84 | Exceptional 11.5% |
| Immigrants | Albania | 99.3 /100 | #85 | Exceptional 11.5% |
| Immigrants | Latvia | 99.2 /100 | #86 | Exceptional 11.6% |
| Immigrants | Nepal | 99.2 /100 | #87 | Exceptional 11.6% |
| Immigrants | Europe | 99.2 /100 | #88 | Exceptional 11.6% |
| Immigrants | Southern Europe | 99.1 /100 | #89 | Exceptional 11.6% |
| Zimbabweans | 99.0 /100 | #90 | Exceptional 11.6% |
| Spanish American Indians | 99.0 /100 | #91 | Exceptional 11.6% |
| Immigrants | Denmark | 98.9 /100 | #92 | Exceptional 11.6% |
| Arabs | 98.9 /100 | #93 | Exceptional 11.6% |
| Immigrants | Fiji | 98.9 /100 | #94 | Exceptional 11.6% |
| Immigrants | Serbia | 98.8 /100 | #95 | Exceptional 11.6% |
| Immigrants | Ukraine | 98.7 /100 | #96 | Exceptional 11.6% |