Alsatian vs Immigrants from Peru Single Father Households
COMPARE
Alsatian
Immigrants from Peru
Single Father Households
Single Father Households Comparison
Alsatians
Immigrants from Peru
2.1%
SINGLE FATHER HOUSEHOLDS
98.9/ 100
METRIC RATING
104th/ 347
METRIC RANK
2.4%
SINGLE FATHER HOUSEHOLDS
19.3/ 100
METRIC RATING
209th/ 347
METRIC RANK
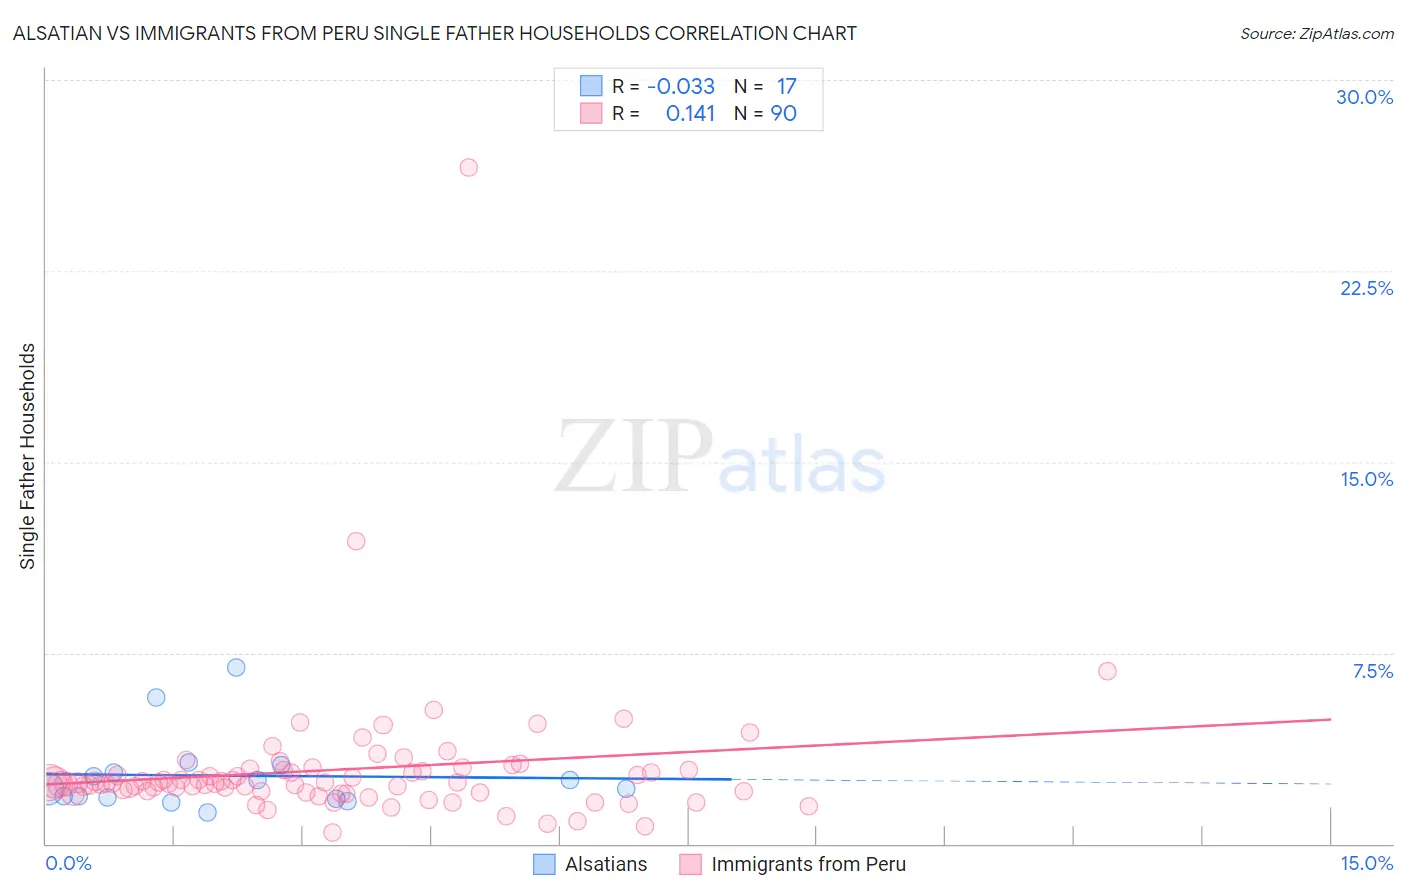
Alsatian vs Immigrants from Peru Single Father Households Correlation Chart
The statistical analysis conducted on geographies consisting of 82,369,441 people shows no correlation between the proportion of Alsatians and percentage of single father households in the United States with a correlation coefficient (R) of -0.033 and weighted average of 2.1%. Similarly, the statistical analysis conducted on geographies consisting of 326,923,065 people shows a poor positive correlation between the proportion of Immigrants from Peru and percentage of single father households in the United States with a correlation coefficient (R) of 0.141 and weighted average of 2.4%, a difference of 11.8%.
Single Father Households Correlation Summary
| Measurement | Alsatian | Immigrants from Peru |
| Minimum | 1.2% | 0.45% |
| Maximum | 6.9% | 26.6% |
| Range | 5.7% | 26.1% |
| Mean | 2.7% | 2.9% |
| Median | 2.2% | 2.4% |
| Interquartile 25% (IQ1) | 1.8% | 2.0% |
| Interquartile 75% (IQ3) | 3.0% | 2.9% |
| Interquartile Range (IQR) | 1.2% | 0.84% |
| Standard Deviation (Sample) | 1.5% | 2.9% |
| Standard Deviation (Population) | 1.4% | 2.9% |
Similar Demographics by Single Father Households
Demographics Similar to Alsatians by Single Father Households
In terms of single father households, the demographic groups most similar to Alsatians are Lebanese (2.1%, a difference of 0.020%), Argentinean (2.1%, a difference of 0.040%), Immigrants from Western Europe (2.1%, a difference of 0.070%), Immigrants from Northern Africa (2.1%, a difference of 0.22%), and South African (2.1%, a difference of 0.37%).
| Demographics | Rating | Rank | Single Father Households |
| Immigrants | Moldova | 99.1 /100 | #97 | Exceptional 2.1% |
| Guyanese | 99.1 /100 | #98 | Exceptional 2.1% |
| South Africans | 99.1 /100 | #99 | Exceptional 2.1% |
| Immigrants | Northern Africa | 99.0 /100 | #100 | Exceptional 2.1% |
| Immigrants | Western Europe | 98.9 /100 | #101 | Exceptional 2.1% |
| Argentineans | 98.9 /100 | #102 | Exceptional 2.1% |
| Lebanese | 98.9 /100 | #103 | Exceptional 2.1% |
| Alsatians | 98.9 /100 | #104 | Exceptional 2.1% |
| Palestinians | 98.6 /100 | #105 | Exceptional 2.2% |
| Immigrants | Southern Europe | 98.6 /100 | #106 | Exceptional 2.2% |
| Slovenes | 98.5 /100 | #107 | Exceptional 2.2% |
| Immigrants | Netherlands | 98.5 /100 | #108 | Exceptional 2.2% |
| Barbadians | 98.4 /100 | #109 | Exceptional 2.2% |
| Italians | 98.3 /100 | #110 | Exceptional 2.2% |
| Immigrants | Canada | 98.3 /100 | #111 | Exceptional 2.2% |
Demographics Similar to Immigrants from Peru by Single Father Households
In terms of single father households, the demographic groups most similar to Immigrants from Peru are Immigrants from Costa Rica (2.4%, a difference of 0.010%), Immigrants from Nigeria (2.4%, a difference of 0.060%), Finnish (2.4%, a difference of 0.11%), Immigrants from Kenya (2.4%, a difference of 0.12%), and Norwegian (2.4%, a difference of 0.26%).
| Demographics | Rating | Rank | Single Father Households |
| German Russians | 25.7 /100 | #202 | Fair 2.4% |
| French Canadians | 24.7 /100 | #203 | Fair 2.4% |
| Ecuadorians | 24.5 /100 | #204 | Fair 2.4% |
| Immigrants | Afghanistan | 24.2 /100 | #205 | Fair 2.4% |
| Koreans | 24.1 /100 | #206 | Fair 2.4% |
| Whites/Caucasians | 22.6 /100 | #207 | Fair 2.4% |
| Immigrants | Kenya | 20.3 /100 | #208 | Fair 2.4% |
| Immigrants | Peru | 19.3 /100 | #209 | Poor 2.4% |
| Immigrants | Costa Rica | 19.2 /100 | #210 | Poor 2.4% |
| Immigrants | Nigeria | 18.7 /100 | #211 | Poor 2.4% |
| Finns | 18.3 /100 | #212 | Poor 2.4% |
| Norwegians | 17.1 /100 | #213 | Poor 2.4% |
| Ethiopians | 16.6 /100 | #214 | Poor 2.4% |
| Immigrants | South Eastern Asia | 15.9 /100 | #215 | Poor 2.4% |
| Immigrants | Ecuador | 14.9 /100 | #216 | Poor 2.4% |