Alsatian vs European Currently Married
COMPARE
Alsatian
European
Currently Married
Currently Married Comparison
Alsatians
Europeans
45.7%
CURRENTLY MARRIED
10.8/ 100
METRIC RATING
208th/ 347
METRIC RANK
49.3%
CURRENTLY MARRIED
99.8/ 100
METRIC RATING
19th/ 347
METRIC RANK
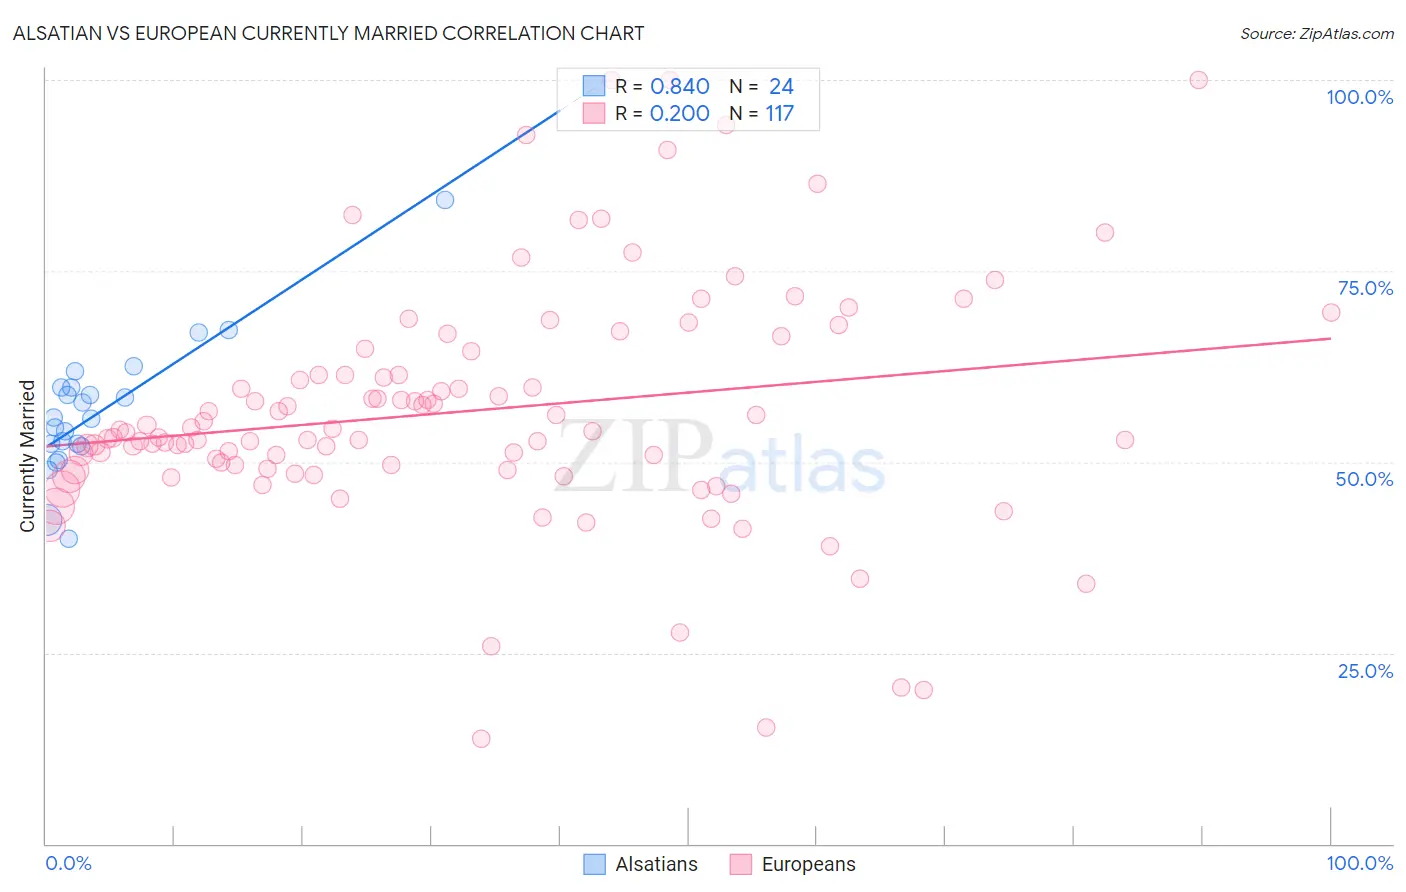
Alsatian vs European Currently Married Correlation Chart
The statistical analysis conducted on geographies consisting of 82,681,658 people shows a very strong positive correlation between the proportion of Alsatians and percentage of population currently married in the United States with a correlation coefficient (R) of 0.840 and weighted average of 45.7%. Similarly, the statistical analysis conducted on geographies consisting of 561,708,680 people shows a poor positive correlation between the proportion of Europeans and percentage of population currently married in the United States with a correlation coefficient (R) of 0.200 and weighted average of 49.3%, a difference of 7.9%.
Currently Married Correlation Summary
| Measurement | Alsatian | European |
| Minimum | 39.9% | 13.8% |
| Maximum | 84.3% | 100.0% |
| Range | 44.4% | 86.2% |
| Mean | 56.5% | 56.7% |
| Median | 55.7% | 53.8% |
| Interquartile 25% (IQ1) | 52.2% | 49.0% |
| Interquartile 75% (IQ3) | 59.7% | 62.9% |
| Interquartile Range (IQR) | 7.5% | 13.9% |
| Standard Deviation (Sample) | 8.8% | 15.8% |
| Standard Deviation (Population) | 8.6% | 15.7% |
Similar Demographics by Currently Married
Demographics Similar to Alsatians by Currently Married
In terms of currently married, the demographic groups most similar to Alsatians are Immigrants from South America (45.7%, a difference of 0.010%), Immigrants (45.8%, a difference of 0.050%), South American Indian (45.8%, a difference of 0.070%), Immigrants from Spain (45.8%, a difference of 0.080%), and Taiwanese (45.8%, a difference of 0.090%).
| Demographics | Rating | Rank | Currently Married |
| Malaysians | 15.3 /100 | #201 | Poor 45.9% |
| Immigrants | Albania | 14.5 /100 | #202 | Poor 45.9% |
| Taiwanese | 11.7 /100 | #203 | Poor 45.8% |
| Immigrants | Spain | 11.6 /100 | #204 | Poor 45.8% |
| South American Indians | 11.5 /100 | #205 | Poor 45.8% |
| Immigrants | Immigrants | 11.2 /100 | #206 | Poor 45.8% |
| Immigrants | South America | 10.8 /100 | #207 | Poor 45.7% |
| Alsatians | 10.8 /100 | #208 | Poor 45.7% |
| Immigrants | Micronesia | 8.8 /100 | #209 | Tragic 45.6% |
| Uruguayans | 7.9 /100 | #210 | Tragic 45.6% |
| Houma | 7.2 /100 | #211 | Tragic 45.5% |
| Marshallese | 7.2 /100 | #212 | Tragic 45.5% |
| Alaska Natives | 7.0 /100 | #213 | Tragic 45.5% |
| Dutch West Indians | 6.7 /100 | #214 | Tragic 45.5% |
| German Russians | 6.7 /100 | #215 | Tragic 45.5% |
Demographics Similar to Europeans by Currently Married
In terms of currently married, the demographic groups most similar to Europeans are Immigrants from Scotland (49.3%, a difference of 0.020%), Luxembourger (49.3%, a difference of 0.14%), Scottish (49.2%, a difference of 0.24%), Scandinavian (49.5%, a difference of 0.31%), and Chinese (49.5%, a difference of 0.33%).
| Demographics | Rating | Rank | Currently Married |
| Swiss | 99.9 /100 | #12 | Exceptional 49.7% |
| Dutch | 99.9 /100 | #13 | Exceptional 49.6% |
| Germans | 99.9 /100 | #14 | Exceptional 49.6% |
| Pennsylvania Germans | 99.9 /100 | #15 | Exceptional 49.6% |
| Chinese | 99.9 /100 | #16 | Exceptional 49.5% |
| Scandinavians | 99.9 /100 | #17 | Exceptional 49.5% |
| Immigrants | Scotland | 99.8 /100 | #18 | Exceptional 49.3% |
| Europeans | 99.8 /100 | #19 | Exceptional 49.3% |
| Luxembourgers | 99.8 /100 | #20 | Exceptional 49.3% |
| Scottish | 99.8 /100 | #21 | Exceptional 49.2% |
| Bulgarians | 99.7 /100 | #22 | Exceptional 49.1% |
| Immigrants | Pakistan | 99.7 /100 | #23 | Exceptional 49.1% |
| Lithuanians | 99.6 /100 | #24 | Exceptional 49.0% |
| Maltese | 99.6 /100 | #25 | Exceptional 49.0% |
| Immigrants | Korea | 99.6 /100 | #26 | Exceptional 49.0% |