Aleut vs Tsimshian Births to Unmarried Women
COMPARE
Aleut
Tsimshian
Births to Unmarried Women
Births to Unmarried Women Comparison
Aleuts
Tsimshian
39.3%
BIRTHS TO UNMARRIED WOMEN
0.0/ 100
METRIC RATING
308th/ 347
METRIC RANK
42.2%
BIRTHS TO UNMARRIED WOMEN
0.0/ 100
METRIC RATING
327th/ 347
METRIC RANK
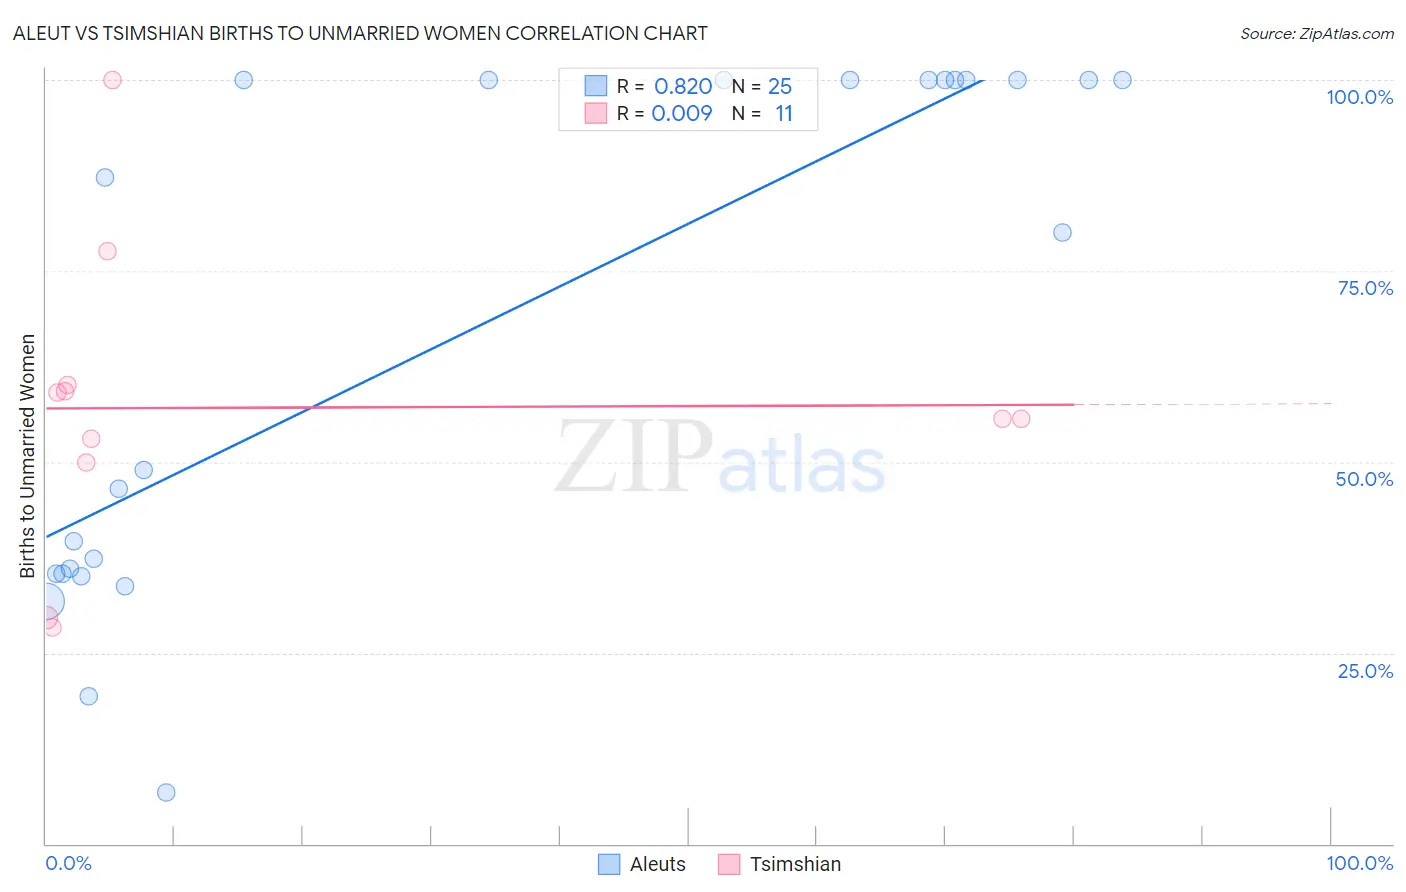
Aleut vs Tsimshian Births to Unmarried Women Correlation Chart
The statistical analysis conducted on geographies consisting of 60,596,367 people shows a very strong positive correlation between the proportion of Aleuts and percentage of births to unmarried women in the United States with a correlation coefficient (R) of 0.820 and weighted average of 39.3%. Similarly, the statistical analysis conducted on geographies consisting of 15,351,381 people shows no correlation between the proportion of Tsimshian and percentage of births to unmarried women in the United States with a correlation coefficient (R) of 0.009 and weighted average of 42.2%, a difference of 7.1%.
Births to Unmarried Women Correlation Summary
| Measurement | Aleut | Tsimshian |
| Minimum | 6.7% | 28.3% |
| Maximum | 100.0% | 100.0% |
| Range | 93.3% | 71.7% |
| Mean | 66.9% | 57.1% |
| Median | 80.0% | 55.6% |
| Interquartile 25% (IQ1) | 35.3% | 50.0% |
| Interquartile 75% (IQ3) | 100.0% | 60.0% |
| Interquartile Range (IQR) | 64.7% | 10.0% |
| Standard Deviation (Sample) | 33.7% | 19.8% |
| Standard Deviation (Population) | 33.0% | 18.9% |
Demographics Similar to Aleuts and Tsimshian by Births to Unmarried Women
In terms of births to unmarried women, the demographic groups most similar to Aleuts are Immigrants from Honduras (39.3%, a difference of 0.090%), Cuban (39.4%, a difference of 0.12%), Immigrants from Dominica (39.5%, a difference of 0.34%), Immigrants from the Azores (39.6%, a difference of 0.58%), and U.S. Virgin Islander (39.6%, a difference of 0.60%). Similarly, the demographic groups most similar to Tsimshian are Immigrants from Cuba (41.5%, a difference of 1.7%), Cheyenne (41.3%, a difference of 1.9%), Cape Verdean (41.3%, a difference of 2.0%), Sioux (41.0%, a difference of 2.8%), and Cajun (41.0%, a difference of 2.9%).
| Demographics | Rating | Rank | Births to Unmarried Women |
| Immigrants | Honduras | 0.0 /100 | #307 | Tragic 39.3% |
| Aleuts | 0.0 /100 | #308 | Tragic 39.3% |
| Cubans | 0.0 /100 | #309 | Tragic 39.4% |
| Immigrants | Dominica | 0.0 /100 | #310 | Tragic 39.5% |
| Immigrants | Azores | 0.0 /100 | #311 | Tragic 39.6% |
| U.S. Virgin Islanders | 0.0 /100 | #312 | Tragic 39.6% |
| Africans | 0.0 /100 | #313 | Tragic 39.7% |
| Immigrants | Caribbean | 0.0 /100 | #314 | Tragic 39.8% |
| Dominicans | 0.0 /100 | #315 | Tragic 39.8% |
| Apache | 0.0 /100 | #316 | Tragic 39.9% |
| Immigrants | Dominican Republic | 0.0 /100 | #317 | Tragic 40.1% |
| Immigrants | Bahamas | 0.0 /100 | #318 | Tragic 40.1% |
| Yakama | 0.0 /100 | #319 | Tragic 40.3% |
| Crow | 0.0 /100 | #320 | Tragic 40.4% |
| Bahamians | 0.0 /100 | #321 | Tragic 40.8% |
| Cajuns | 0.0 /100 | #322 | Tragic 41.0% |
| Sioux | 0.0 /100 | #323 | Tragic 41.0% |
| Cape Verdeans | 0.0 /100 | #324 | Tragic 41.3% |
| Cheyenne | 0.0 /100 | #325 | Tragic 41.3% |
| Immigrants | Cuba | 0.0 /100 | #326 | Tragic 41.5% |
| Tsimshian | 0.0 /100 | #327 | Tragic 42.2% |