Albanian vs Jordanian Births to Unmarried Women
COMPARE
Albanian
Jordanian
Births to Unmarried Women
Births to Unmarried Women Comparison
Albanians
Jordanians
28.5%
BIRTHS TO UNMARRIED WOMEN
98.5/ 100
METRIC RATING
73rd/ 347
METRIC RANK
28.5%
BIRTHS TO UNMARRIED WOMEN
98.5/ 100
METRIC RATING
71st/ 347
METRIC RANK
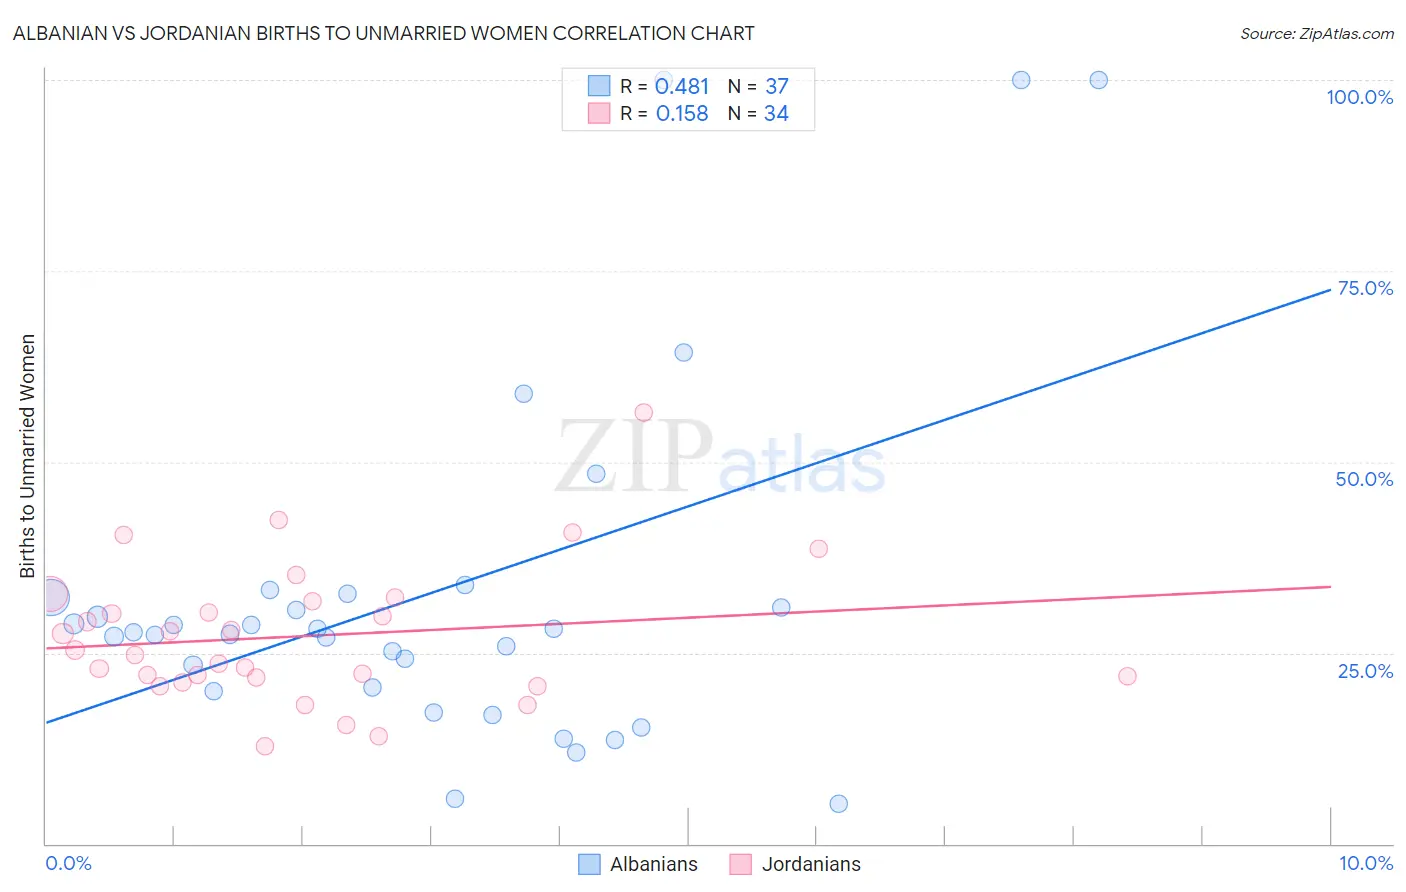
Albanian vs Jordanian Births to Unmarried Women Correlation Chart
The statistical analysis conducted on geographies consisting of 182,909,720 people shows a moderate positive correlation between the proportion of Albanians and percentage of births to unmarried women in the United States with a correlation coefficient (R) of 0.481 and weighted average of 28.5%. Similarly, the statistical analysis conducted on geographies consisting of 160,910,775 people shows a poor positive correlation between the proportion of Jordanians and percentage of births to unmarried women in the United States with a correlation coefficient (R) of 0.158 and weighted average of 28.5%, a difference of 0.11%.
Births to Unmarried Women Correlation Summary
| Measurement | Albanian | Jordanian |
| Minimum | 5.2% | 12.8% |
| Maximum | 100.0% | 56.4% |
| Range | 94.8% | 43.6% |
| Mean | 32.8% | 27.2% |
| Median | 27.7% | 25.0% |
| Interquartile 25% (IQ1) | 20.2% | 21.7% |
| Interquartile 75% (IQ3) | 32.5% | 31.7% |
| Interquartile Range (IQR) | 12.3% | 10.0% |
| Standard Deviation (Sample) | 23.4% | 9.1% |
| Standard Deviation (Population) | 23.1% | 9.0% |
Demographics Similar to Albanians and Jordanians by Births to Unmarried Women
In terms of births to unmarried women, the demographic groups most similar to Albanians are Immigrants from Bolivia (28.6%, a difference of 0.020%), Immigrants from Sweden (28.5%, a difference of 0.050%), Immigrants from Switzerland (28.6%, a difference of 0.11%), Israeli (28.6%, a difference of 0.13%), and Laotian (28.5%, a difference of 0.29%). Similarly, the demographic groups most similar to Jordanians are Immigrants from Sweden (28.5%, a difference of 0.060%), Immigrants from Bolivia (28.6%, a difference of 0.13%), Laotian (28.5%, a difference of 0.18%), Immigrants from Switzerland (28.6%, a difference of 0.22%), and Israeli (28.6%, a difference of 0.23%).
| Demographics | Rating | Rank | Births to Unmarried Women |
| Egyptians | 99.0 /100 | #62 | Exceptional 28.2% |
| Immigrants | Serbia | 98.9 /100 | #63 | Exceptional 28.3% |
| Tongans | 98.8 /100 | #64 | Exceptional 28.4% |
| Immigrants | Czechoslovakia | 98.8 /100 | #65 | Exceptional 28.4% |
| Immigrants | Egypt | 98.8 /100 | #66 | Exceptional 28.4% |
| Palestinians | 98.7 /100 | #67 | Exceptional 28.4% |
| Immigrants | Europe | 98.7 /100 | #68 | Exceptional 28.4% |
| Bolivians | 98.7 /100 | #69 | Exceptional 28.5% |
| Laotians | 98.6 /100 | #70 | Exceptional 28.5% |
| Jordanians | 98.5 /100 | #71 | Exceptional 28.5% |
| Immigrants | Sweden | 98.5 /100 | #72 | Exceptional 28.5% |
| Albanians | 98.5 /100 | #73 | Exceptional 28.5% |
| Immigrants | Bolivia | 98.5 /100 | #74 | Exceptional 28.6% |
| Immigrants | Switzerland | 98.4 /100 | #75 | Exceptional 28.6% |
| Israelis | 98.4 /100 | #76 | Exceptional 28.6% |
| Immigrants | Northern Europe | 98.3 /100 | #77 | Exceptional 28.6% |
| Zimbabweans | 98.2 /100 | #78 | Exceptional 28.7% |
| Danes | 98.2 /100 | #79 | Exceptional 28.7% |
| Immigrants | Afghanistan | 98.1 /100 | #80 | Exceptional 28.7% |
| Immigrants | Austria | 98.1 /100 | #81 | Exceptional 28.7% |
| Romanians | 98.0 /100 | #82 | Exceptional 28.7% |