Alaska Native vs Finnish Divorced or Separated
COMPARE
Alaska Native
Finnish
Divorced or Separated
Divorced or Separated Comparison
Alaska Natives
Finns
12.4%
DIVORCED OR SEPARATED
2.5/ 100
METRIC RATING
244th/ 347
METRIC RANK
12.5%
DIVORCED OR SEPARATED
1.8/ 100
METRIC RATING
249th/ 347
METRIC RANK
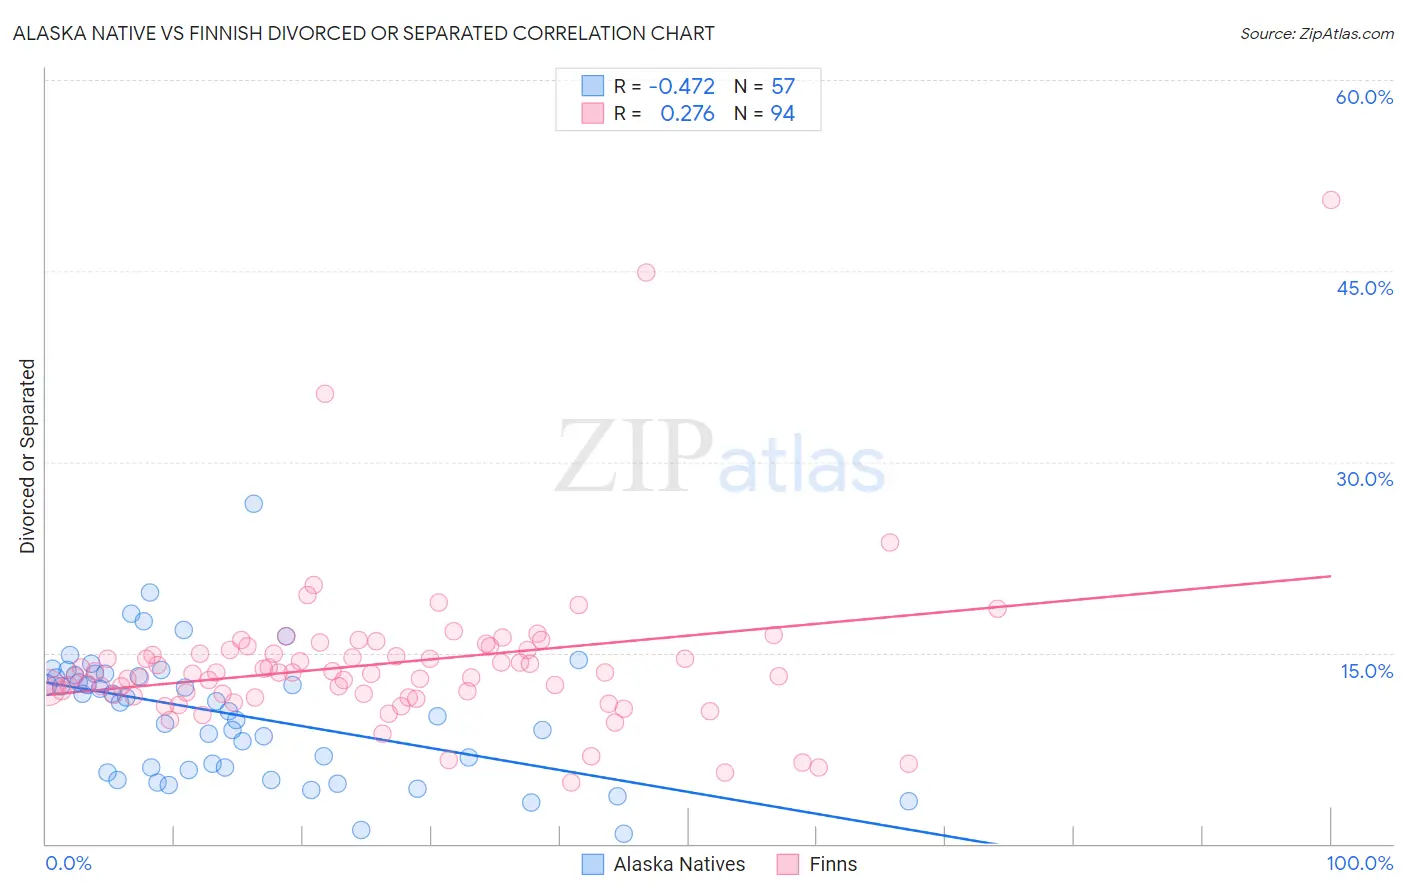
Alaska Native vs Finnish Divorced or Separated Correlation Chart
The statistical analysis conducted on geographies consisting of 76,749,799 people shows a moderate negative correlation between the proportion of Alaska Natives and percentage of population currently divorced or separated in the United States with a correlation coefficient (R) of -0.472 and weighted average of 12.4%. Similarly, the statistical analysis conducted on geographies consisting of 404,587,172 people shows a weak positive correlation between the proportion of Finns and percentage of population currently divorced or separated in the United States with a correlation coefficient (R) of 0.276 and weighted average of 12.5%, a difference of 0.31%.
Divorced or Separated Correlation Summary
| Measurement | Alaska Native | Finnish |
| Minimum | 0.80% | 4.8% |
| Maximum | 26.7% | 50.5% |
| Range | 25.9% | 45.7% |
| Mean | 10.2% | 14.1% |
| Median | 11.1% | 13.4% |
| Interquartile 25% (IQ1) | 5.9% | 11.7% |
| Interquartile 75% (IQ3) | 13.3% | 15.2% |
| Interquartile Range (IQR) | 7.4% | 3.5% |
| Standard Deviation (Sample) | 5.0% | 6.3% |
| Standard Deviation (Population) | 4.9% | 6.3% |
Demographics Similar to Alaska Natives and Finns by Divorced or Separated
In terms of divorced or separated, the demographic groups most similar to Alaska Natives are Immigrants from Latin America (12.4%, a difference of 0.10%), Dutch (12.4%, a difference of 0.17%), Hispanic or Latino (12.5%, a difference of 0.22%), Immigrants from West Indies (12.5%, a difference of 0.24%), and Uruguayan (12.4%, a difference of 0.25%). Similarly, the demographic groups most similar to Finns are Nepalese (12.5%, a difference of 0.010%), German (12.5%, a difference of 0.040%), Immigrants from West Indies (12.5%, a difference of 0.070%), Hispanic or Latino (12.5%, a difference of 0.090%), and Irish (12.5%, a difference of 0.27%).
| Demographics | Rating | Rank | Divorced or Separated |
| Colombians | 4.2 /100 | #236 | Tragic 12.4% |
| Immigrants | Laos | 4.2 /100 | #237 | Tragic 12.4% |
| Sudanese | 4.0 /100 | #238 | Tragic 12.4% |
| Immigrants | Germany | 4.0 /100 | #239 | Tragic 12.4% |
| British West Indians | 3.7 /100 | #240 | Tragic 12.4% |
| Uruguayans | 3.4 /100 | #241 | Tragic 12.4% |
| Dutch | 3.1 /100 | #242 | Tragic 12.4% |
| Immigrants | Latin America | 2.8 /100 | #243 | Tragic 12.4% |
| Alaska Natives | 2.5 /100 | #244 | Tragic 12.4% |
| Hispanics or Latinos | 2.0 /100 | #245 | Tragic 12.5% |
| Immigrants | West Indies | 1.9 /100 | #246 | Tragic 12.5% |
| Germans | 1.8 /100 | #247 | Tragic 12.5% |
| Nepalese | 1.8 /100 | #248 | Tragic 12.5% |
| Finns | 1.8 /100 | #249 | Tragic 12.5% |
| Irish | 1.3 /100 | #250 | Tragic 12.5% |
| Aleuts | 1.3 /100 | #251 | Tragic 12.5% |
| Liberians | 0.9 /100 | #252 | Tragic 12.6% |
| Somalis | 0.9 /100 | #253 | Tragic 12.6% |
| Senegalese | 0.8 /100 | #254 | Tragic 12.6% |
| Welsh | 0.7 /100 | #255 | Tragic 12.6% |
| Immigrants | Colombia | 0.6 /100 | #256 | Tragic 12.6% |