African vs Immigrants from Pakistan Average Family Size
COMPARE
African
Immigrants from Pakistan
Average Family Size
Average Family Size Comparison
Africans
Immigrants from Pakistan
3.25
AVERAGE FAMILY SIZE
84.9/ 100
METRIC RATING
134th/ 347
METRIC RANK
3.30
AVERAGE FAMILY SIZE
99.2/ 100
METRIC RATING
91st/ 347
METRIC RANK
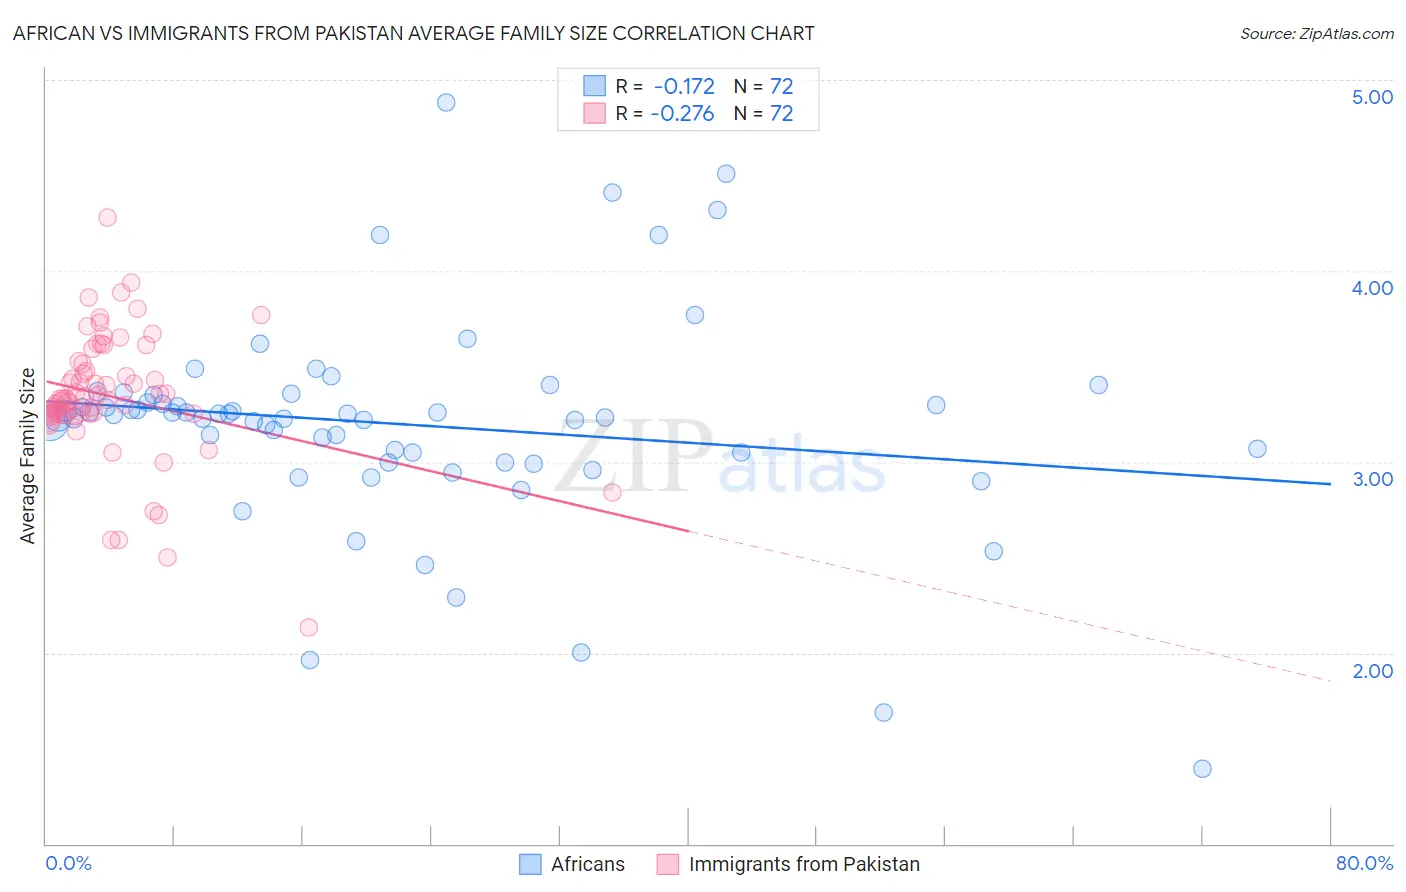
African vs Immigrants from Pakistan Average Family Size Correlation Chart
The statistical analysis conducted on geographies consisting of 469,598,302 people shows a poor negative correlation between the proportion of Africans and average family size in the United States with a correlation coefficient (R) of -0.172 and weighted average of 3.25. Similarly, the statistical analysis conducted on geographies consisting of 283,802,176 people shows a weak negative correlation between the proportion of Immigrants from Pakistan and average family size in the United States with a correlation coefficient (R) of -0.276 and weighted average of 3.30, a difference of 1.4%.
Average Family Size Correlation Summary
| Measurement | African | Immigrants from Pakistan |
| Minimum | 1.39 | 2.13 |
| Maximum | 4.88 | 4.28 |
| Range | 3.49 | 2.15 |
| Mean | 3.20 | 3.34 |
| Median | 3.24 | 3.33 |
| Interquartile 25% (IQ1) | 3.02 | 3.25 |
| Interquartile 75% (IQ3) | 3.33 | 3.52 |
| Interquartile Range (IQR) | 0.31 | 0.27 |
| Standard Deviation (Sample) | 0.56 | 0.34 |
| Standard Deviation (Population) | 0.55 | 0.34 |
Similar Demographics by Average Family Size
Demographics Similar to Africans by Average Family Size
In terms of average family size, the demographic groups most similar to Africans are Panamanian (3.25, a difference of 0.020%), Immigrants from Venezuela (3.26, a difference of 0.050%), Costa Rican (3.26, a difference of 0.070%), Comanche (3.25, a difference of 0.070%), and Immigrants from Middle Africa (3.25, a difference of 0.080%).
| Demographics | Rating | Rank | Average Family Size |
| Immigrants | Syria | 90.6 /100 | #127 | Exceptional 3.26 |
| Colombians | 89.9 /100 | #128 | Excellent 3.26 |
| Immigrants | Hong Kong | 88.6 /100 | #129 | Excellent 3.26 |
| Laotians | 88.5 /100 | #130 | Excellent 3.26 |
| Immigrants | Western Asia | 87.7 /100 | #131 | Excellent 3.26 |
| Costa Ricans | 86.8 /100 | #132 | Excellent 3.26 |
| Immigrants | Venezuela | 86.3 /100 | #133 | Excellent 3.26 |
| Africans | 84.9 /100 | #134 | Excellent 3.25 |
| Panamanians | 84.2 /100 | #135 | Excellent 3.25 |
| Comanche | 82.8 /100 | #136 | Excellent 3.25 |
| Immigrants | Middle Africa | 82.4 /100 | #137 | Excellent 3.25 |
| Cubans | 81.8 /100 | #138 | Excellent 3.25 |
| Immigrants | Ethiopia | 81.6 /100 | #139 | Excellent 3.25 |
| Sub-Saharan Africans | 81.6 /100 | #140 | Excellent 3.25 |
| Venezuelans | 81.4 /100 | #141 | Excellent 3.25 |
Demographics Similar to Immigrants from Pakistan by Average Family Size
In terms of average family size, the demographic groups most similar to Immigrants from Pakistan are Immigrants from Cameroon (3.30, a difference of 0.010%), Peruvian (3.30, a difference of 0.020%), Sierra Leonean (3.30, a difference of 0.12%), Immigrants from Lebanon (3.30, a difference of 0.13%), and Menominee (3.30, a difference of 0.15%).
| Demographics | Rating | Rank | Average Family Size |
| Immigrants | Nigeria | 99.7 /100 | #84 | Exceptional 3.32 |
| Afghans | 99.7 /100 | #85 | Exceptional 3.31 |
| Jamaicans | 99.7 /100 | #86 | Exceptional 3.31 |
| Immigrants | Peru | 99.7 /100 | #87 | Exceptional 3.31 |
| Immigrants | Bolivia | 99.6 /100 | #88 | Exceptional 3.31 |
| Malaysians | 99.6 /100 | #89 | Exceptional 3.31 |
| Menominee | 99.4 /100 | #90 | Exceptional 3.30 |
| Immigrants | Pakistan | 99.2 /100 | #91 | Exceptional 3.30 |
| Immigrants | Cameroon | 99.2 /100 | #92 | Exceptional 3.30 |
| Peruvians | 99.2 /100 | #93 | Exceptional 3.30 |
| Sierra Leoneans | 99.0 /100 | #94 | Exceptional 3.30 |
| Immigrants | Lebanon | 99.0 /100 | #95 | Exceptional 3.30 |
| U.S. Virgin Islanders | 98.8 /100 | #96 | Exceptional 3.29 |
| Immigrants | Oceania | 98.7 /100 | #97 | Exceptional 3.29 |
| Barbadians | 98.6 /100 | #98 | Exceptional 3.29 |