Zimbabwean vs Iraqi Doctorate Degree
COMPARE
Zimbabwean
Iraqi
Doctorate Degree
Doctorate Degree Comparison
Zimbabweans
Iraqis
2.3%
DOCTORATE DEGREE
99.8/ 100
METRIC RATING
67th/ 347
METRIC RANK
1.8%
DOCTORATE DEGREE
49.2/ 100
METRIC RATING
177th/ 347
METRIC RANK
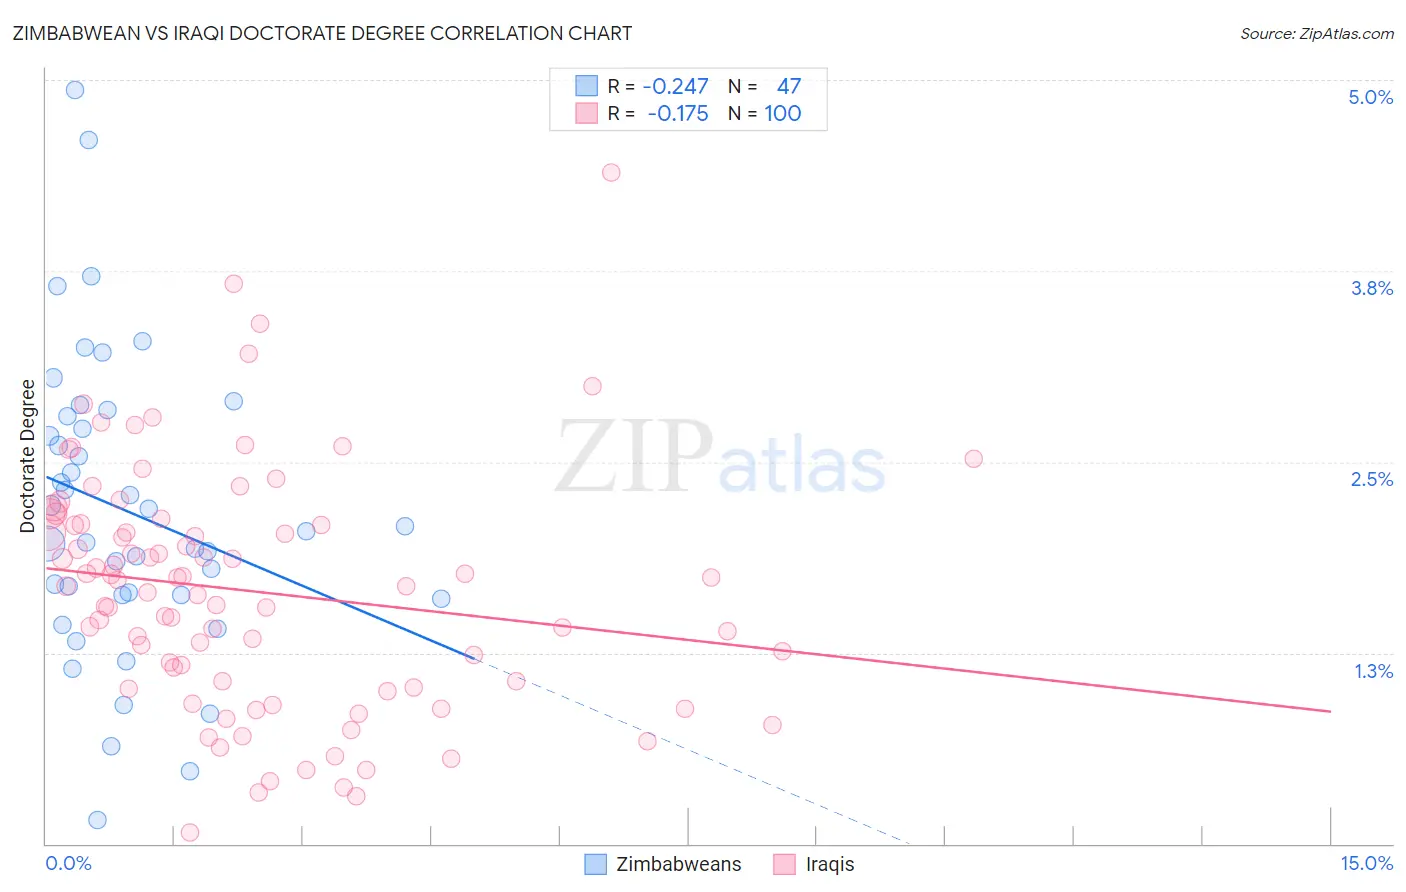
Zimbabwean vs Iraqi Doctorate Degree Correlation Chart
The statistical analysis conducted on geographies consisting of 69,036,010 people shows a weak negative correlation between the proportion of Zimbabweans and percentage of population with at least doctorate degree education in the United States with a correlation coefficient (R) of -0.247 and weighted average of 2.3%. Similarly, the statistical analysis conducted on geographies consisting of 170,189,095 people shows a poor negative correlation between the proportion of Iraqis and percentage of population with at least doctorate degree education in the United States with a correlation coefficient (R) of -0.175 and weighted average of 1.8%, a difference of 23.7%.
Doctorate Degree Correlation Summary
| Measurement | Zimbabwean | Iraqi |
| Minimum | 0.16% | 0.073% |
| Maximum | 4.9% | 4.4% |
| Range | 4.8% | 4.3% |
| Mean | 2.2% | 1.7% |
| Median | 2.0% | 1.7% |
| Interquartile 25% (IQ1) | 1.6% | 1.0% |
| Interquartile 75% (IQ3) | 2.8% | 2.1% |
| Interquartile Range (IQR) | 1.2% | 1.0% |
| Standard Deviation (Sample) | 0.98% | 0.79% |
| Standard Deviation (Population) | 0.97% | 0.79% |
Similar Demographics by Doctorate Degree
Demographics Similar to Zimbabweans by Doctorate Degree
In terms of doctorate degree, the demographic groups most similar to Zimbabweans are Immigrants from Kazakhstan (2.3%, a difference of 0.23%), Argentinean (2.3%, a difference of 0.46%), Carpatho Rusyn (2.3%, a difference of 0.48%), Lithuanian (2.3%, a difference of 0.62%), and Immigrants from Bolivia (2.3%, a difference of 0.62%).
| Demographics | Rating | Rank | Doctorate Degree |
| Immigrants | Serbia | 99.9 /100 | #60 | Exceptional 2.3% |
| Bhutanese | 99.9 /100 | #61 | Exceptional 2.3% |
| Immigrants | Europe | 99.9 /100 | #62 | Exceptional 2.3% |
| Laotians | 99.9 /100 | #63 | Exceptional 2.3% |
| Immigrants | Greece | 99.9 /100 | #64 | Exceptional 2.3% |
| Paraguayans | 99.9 /100 | #65 | Exceptional 2.3% |
| Argentineans | 99.9 /100 | #66 | Exceptional 2.3% |
| Zimbabweans | 99.8 /100 | #67 | Exceptional 2.3% |
| Immigrants | Kazakhstan | 99.8 /100 | #68 | Exceptional 2.3% |
| Carpatho Rusyns | 99.8 /100 | #69 | Exceptional 2.3% |
| Lithuanians | 99.8 /100 | #70 | Exceptional 2.3% |
| Immigrants | Bolivia | 99.8 /100 | #71 | Exceptional 2.3% |
| Immigrants | Canada | 99.8 /100 | #72 | Exceptional 2.3% |
| Immigrants | Bulgaria | 99.8 /100 | #73 | Exceptional 2.3% |
| Immigrants | North America | 99.8 /100 | #74 | Exceptional 2.2% |
Demographics Similar to Iraqis by Doctorate Degree
In terms of doctorate degree, the demographic groups most similar to Iraqis are Spanish (1.8%, a difference of 0.010%), Immigrants from Thailand (1.8%, a difference of 0.030%), French (1.8%, a difference of 0.060%), Immigrants from Bangladesh (1.8%, a difference of 0.11%), and Norwegian (1.8%, a difference of 0.12%).
| Demographics | Rating | Rank | Doctorate Degree |
| Costa Ricans | 53.3 /100 | #170 | Average 1.8% |
| Bermudans | 52.1 /100 | #171 | Average 1.8% |
| Belgians | 50.3 /100 | #172 | Average 1.8% |
| Norwegians | 50.0 /100 | #173 | Average 1.8% |
| Immigrants | Bangladesh | 50.0 /100 | #174 | Average 1.8% |
| Immigrants | Thailand | 49.4 /100 | #175 | Average 1.8% |
| Spanish | 49.3 /100 | #176 | Average 1.8% |
| Iraqis | 49.2 /100 | #177 | Average 1.8% |
| French | 48.8 /100 | #178 | Average 1.8% |
| Ghanaians | 48.3 /100 | #179 | Average 1.8% |
| Scandinavians | 48.0 /100 | #180 | Average 1.8% |
| Immigrants | Immigrants | 46.2 /100 | #181 | Average 1.8% |
| Immigrants | Afghanistan | 44.3 /100 | #182 | Average 1.8% |
| Finns | 42.1 /100 | #183 | Average 1.8% |
| Nigerians | 39.9 /100 | #184 | Fair 1.8% |